SpectraMax i3x assay optimization guide
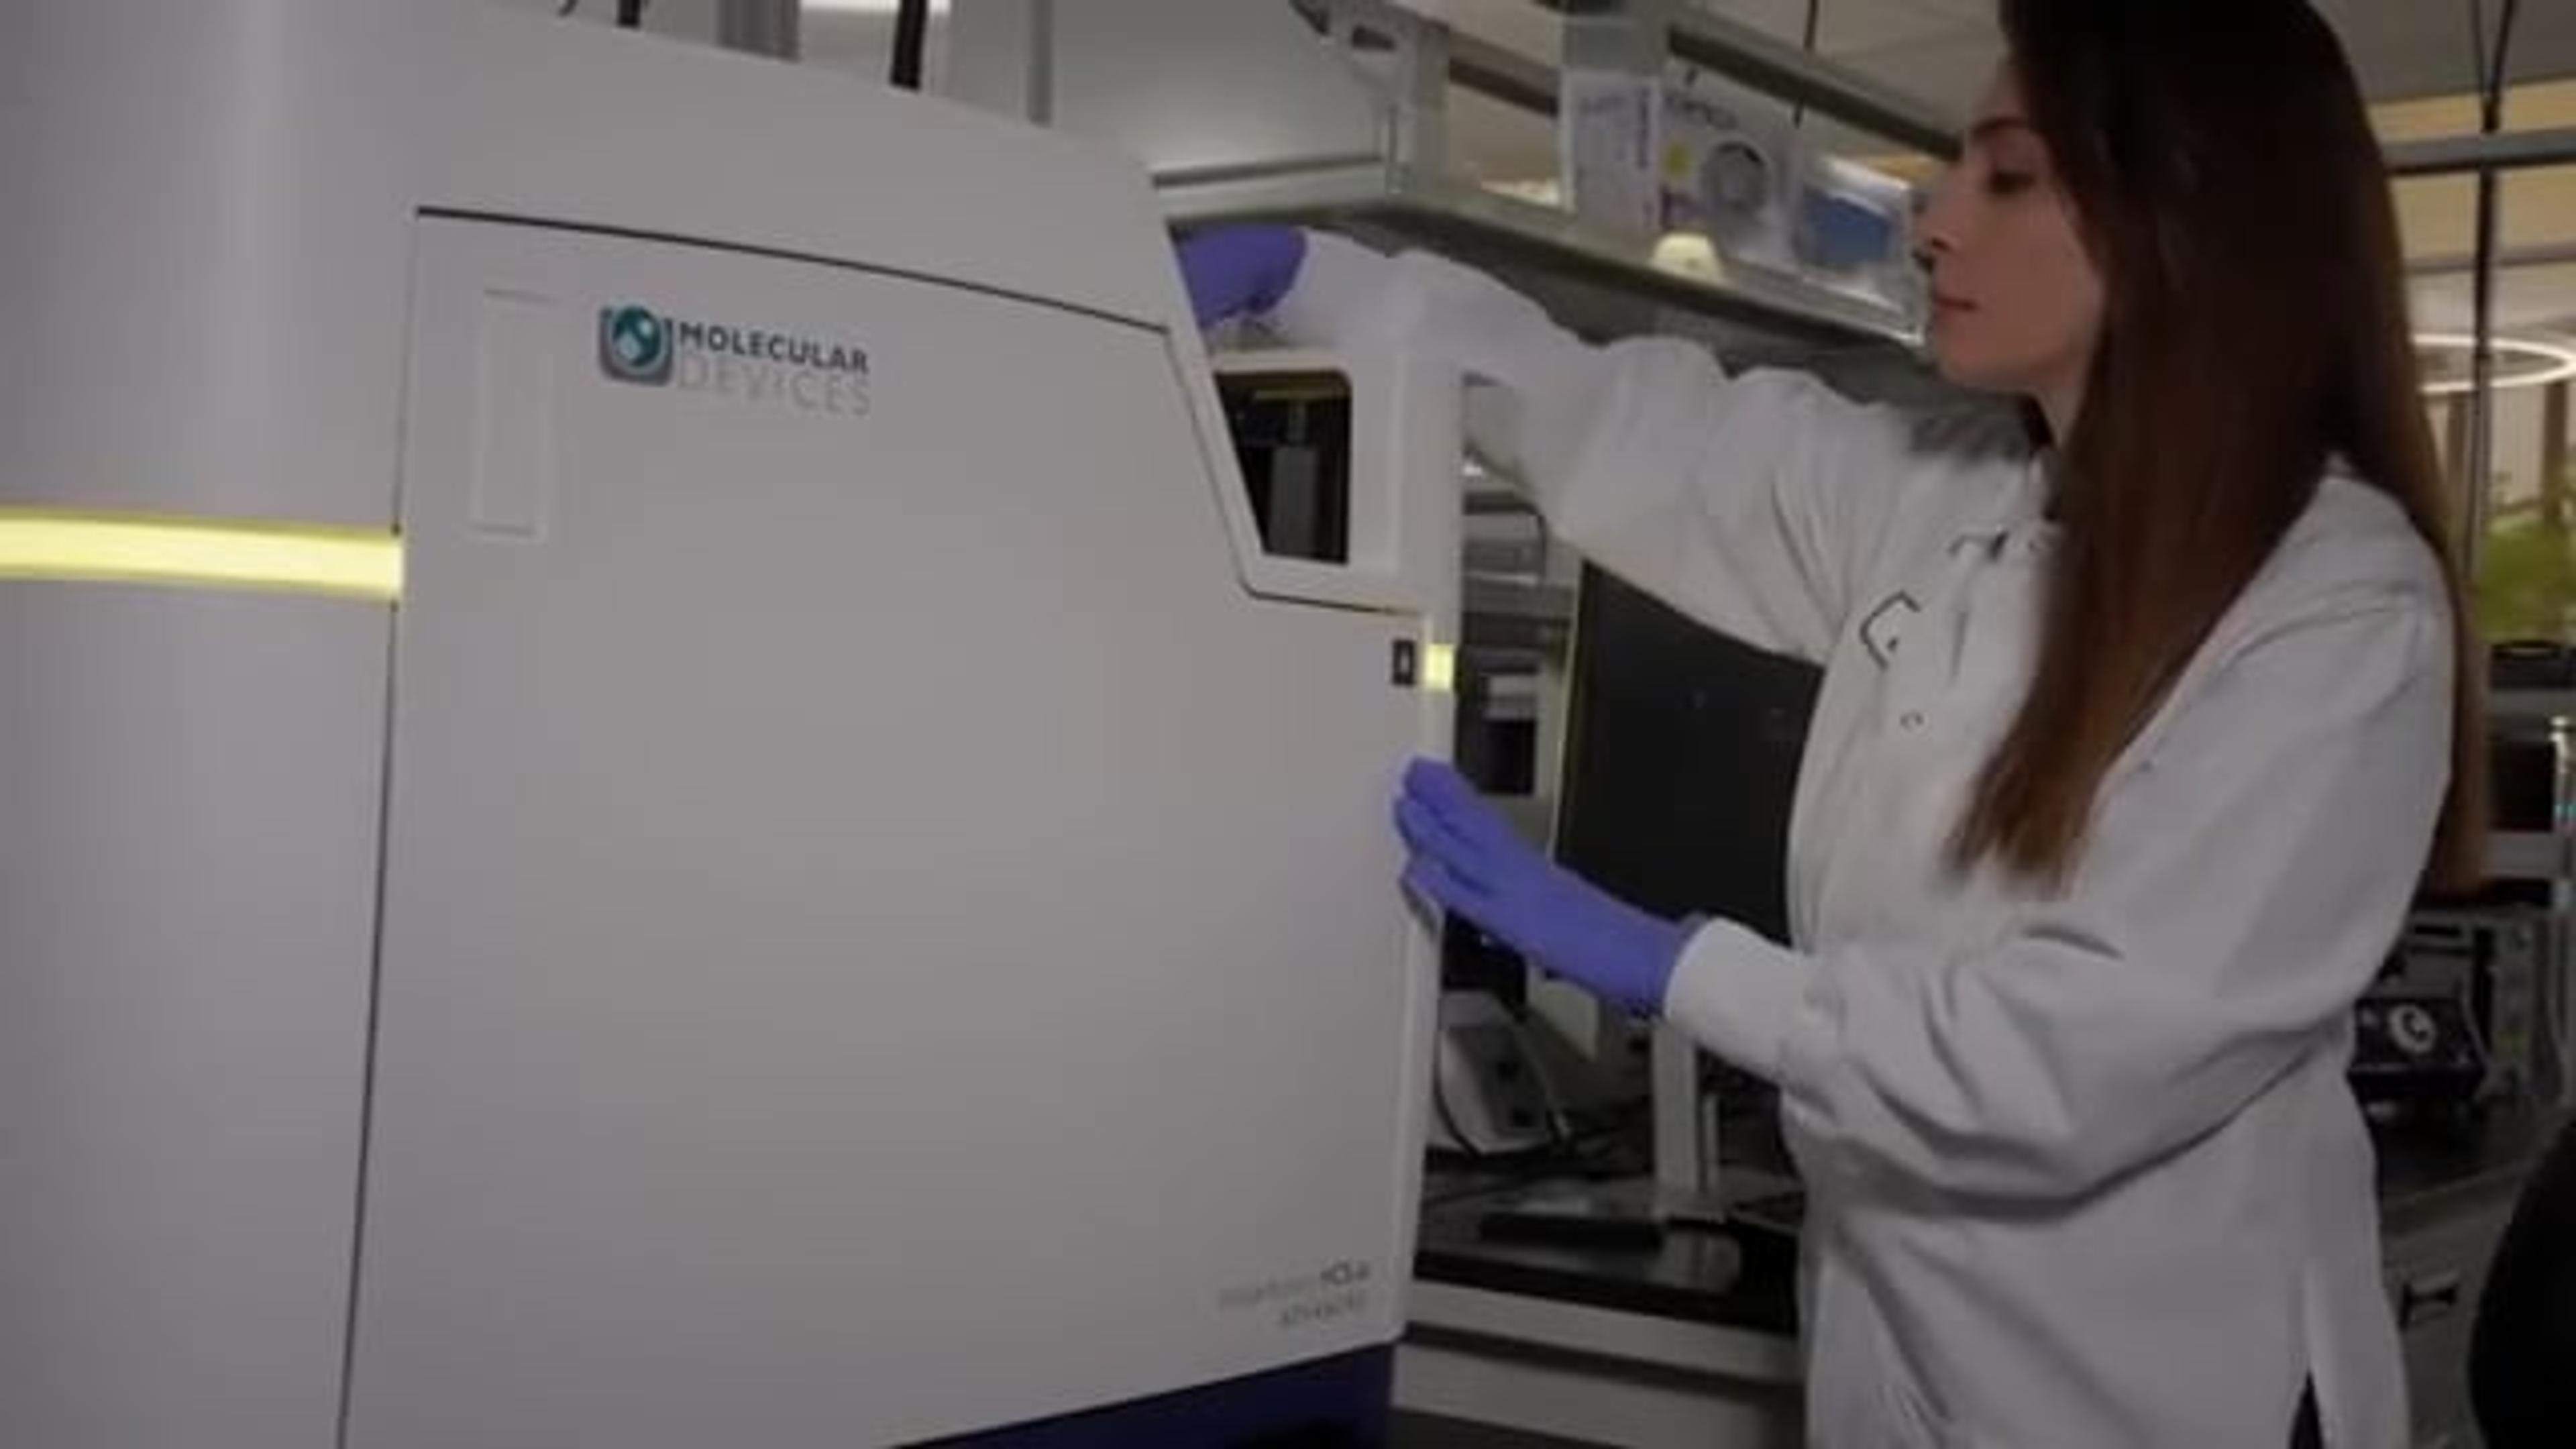
24 Sept 2026This video demonstrates essential assay optimization techniques for fluorescence and luminescence measurements using the SpectraMax® i3x. Learn how to optimize microplate alignment, Z-height for precise focus, and identify optimal excitation and emission wavelengths for enhanced assay sensitivity and accuracy. The tutorial covers practical steps within the SoftMax Pro® software for efficient and reliable experimental setup.
About the company

Molecular Devices®
Molecular Devices is one of the world’s leading providers of high-performance bioanalytical measurement systems, software and consumables for life science research, pharmaceutical and biotherapeutic development. Included within a broad product portfolio are platforms for high-throughput screening, genomic and cellular analysis, colony selection and microplate detection. These leading-edge products enable scientists to improve productivity and effectiveness, ultimately accelerating research and the discovery of new therapeutics. Molecular Devices is committed to the continual development of innovative solutions for life science applications. The company is headquartered in Silicon Valley, California, with offices around the globe. For more information, please visit www.moleculardevices.com.
General Inquiry - USA & Canada: +1 800-635-5577 General Inquiry - Europe: 00800 665 32860 Sales +1 877-589-2214 Support +1 800 635 5577
Video transcript
Show transcript
1
00:00:00.480 --> 00:00:04.320
My name is Caroline Cardenal. I am an application scientist for Molecular Devices,
2
00:00:04.860 --> 00:00:09.000
and in today's video, we're going to review how to optimize an assay in
3
00:00:09.060 --> 00:00:13.260
fluorescence or luminescence using the SpectraMax i3x.
4
00:00:14.280 --> 00:00:19.170
First of all, let's review the three optimizations you can do with the i3x.
5
00:00:20.160 --> 00:00:23.040
First of all, the microplate optimization.
6
00:00:23.070 --> 00:00:26.850
This optimization is recommended to realign the read head with the center of the
7
00:00:26.881 --> 00:00:32.280
well where the signal is the highest, and you will need a fluorescence or
8
00:00:32.340 --> 00:00:34.770
luminescence solution in the four corners of the microplate.
9
00:00:35.745 --> 00:00:40.245
This optimization is recommended for 96 well plate, and it is really a necessity
10
00:00:40.260 --> 00:00:44.760
for 384 well plate if you want to increase the sensitivity for your assay.
11
00:00:46.260 --> 00:00:49.740
The second optimization is a Z-height optimization.
12
00:00:49.770 --> 00:00:54.960
This is for the PrID only, and in that case, it will be a live in focus.
13
00:00:55.051 --> 00:01:00.270
Exactly like a camera, the lens will go at different height
14
00:01:01.080 --> 00:01:06.360
in order to measure the signal, and you will report the height at which the signal
15
00:01:06.450 --> 00:01:07.260
is the strongest.
16
00:01:08.640 --> 00:01:13.560
The last optimization is the wavelengths optimization, and this is basically to
17
00:01:13.650 --> 00:01:18.900
find the best excitation and emission couple for your assay.
18
00:01:21.540 --> 00:01:25.860
Let's go into SoftMax Pro to have a look how to set up those optimization.
19
00:01:26.670 --> 00:01:30.420
You can select the instrument setting from the main menu or by selecting the second
20
00:01:30.480 --> 00:01:31.860
icon of the plate menu.
21
00:01:34.080 --> 00:01:38.610
You will have the optical configuration, and you can choose either monochromator or
22
00:01:38.670 --> 00:01:41.461
fluorescence or luminescence cartridge.
23
00:01:41.521 --> 00:01:46.141
In term of read mode, this optimization is only for fluorescence and luminescence.
24
00:01:47.400 --> 00:01:52.290
In the wavelengths window, the default option selected is known.
25
00:01:53.101 --> 00:01:57.269
But here we're going to select unknown in order to start the optimization result
26
00:01:57.360 --> 00:01:58.740
when we click on Read.
27
00:02:00.391 --> 00:02:05.325
Then we're going to select a plate, and here we're going to select a 384 well
28
00:02:05.400 --> 00:02:05.760
plate,
29
00:02:07.500 --> 00:02:13.351
and we're going to select standard opaque for fluorescence intensity.
30
00:02:15.870 --> 00:02:21.840
In TNT objects, you're going to have the set height value that is
31
00:02:21.870 --> 00:02:27.391
set to one millimeter at default and will be updated when this is done.
32
00:02:27.480 --> 00:02:33.300
And in more settings, the pre-read optimization option should be selected.
33
00:02:34.860 --> 00:02:35.280
Click OK,
34
00:02:36.960 --> 00:02:39.540
and then we need to click on Read.
35
00:02:42.855 --> 00:02:47.340
The spectral optimization wizard will now appear, and you will have to adjust the
36
00:02:47.370 --> 00:02:50.250
wavelengths for the excitation and the emission scan.
37
00:02:51.150 --> 00:02:56.101
As guideline, we will take the literature value and add plus or minus 25 nanometer.
38
00:02:57.090 --> 00:03:01.230
Here we're working with fluorescein, so we're going to choose start for the
39
00:03:01.260 --> 00:03:07.141
excitation scan at 460 and the end of the excitation scan at 510.
40
00:03:08.101 --> 00:03:13.799
For the emission scan, the start is going to be at 500 and the end is going to
41
00:03:13.860 --> 00:03:19.740
be at 550. You need at least 10 points for the excitation and 10
42
00:03:19.770 --> 00:03:22.890
points for the emission for the scan to be able to work.
43
00:03:24.060 --> 00:03:26.610
Then you have to select a blank well, which will be your buffer,
44
00:03:28.171 --> 00:03:31.921
and click on Next, and the sample well, which can be any well of the microplate,
45
00:03:32.760 --> 00:03:34.351
and select Next.
46
00:03:35.701 --> 00:03:41.595
The optimization wizard will start, and it can take seven to eight minutes or
47
00:03:41.671 --> 00:03:45.031
longer, depending on the number of points you have in your scan.
48
00:03:45.421 --> 00:03:49.470
Once the optimization is finished, you will have a heat map that will appear, and
49
00:03:49.500 --> 00:03:54.705
it will show you a cursor showing the best excitation and emission couple for your
50
00:03:54.750 --> 00:04:00.720
fluorophore. This is the excitation versus the emission, and we have three zone,
51
00:04:01.500 --> 00:04:06.390
a light gray zone that is not allowed, a dark gray zone where you can have some
52
00:04:06.451 --> 00:04:11.580
excitation like in the emission spectrum, and the last zone
53
00:04:12.150 --> 00:04:17.760
where you have no excitation in the emission spectrum.
54
00:04:17.791 --> 00:04:22.531
The cursor will show you the best excitation emission peak, but you can move that
55
00:04:22.591 --> 00:04:28.560
cursor to any region of the scan. The value next to the cursor
56
00:04:28.890 --> 00:04:30.810
is showing the signal-to-background ratio,
57
00:04:32.040 --> 00:04:37.830
and have a look at that value as it might be in units, in tens, hundreds, or
58
00:04:38.190 --> 00:04:38.880
thousands.
59
00:04:40.380 --> 00:04:46.201
You can restart the visit if you don't like the values you're getting, or you
60
00:04:46.260 --> 00:04:49.020
can reset to the optimized peak if you have moved that cursor.
61
00:04:50.281 --> 00:04:53.190
You can then click on Read to use the optimized wavelengths.
62
00:04:53.970 --> 00:04:58.410
A proofing window will appear, and you'll be able to select microplate
63
00:04:58.560 --> 00:05:01.860
optimization and Z-height optimization.
64
00:05:03.240 --> 00:05:04.710
Click Run Optimization.
65
00:05:05.970 --> 00:05:09.480
For the microplate optimization, this is to remind you that you need to put some
66
00:05:09.540 --> 00:05:13.230
fluorescence or luminescence material in the four corners.
67
00:05:13.710 --> 00:05:19.260
The optimization will start, and it can take between six to seven minutes.
68
00:05:19.890 --> 00:05:25.065
When the optimization is finished, we'll have a shooting target-like picture that
69
00:05:25.080 --> 00:05:30.600
will appear, and you have to realign the cursor with the center of the microplate
70
00:05:30.630 --> 00:05:35.460
where the signal is the highest. You have to do this for the four corners, one
71
00:05:35.490 --> 00:05:41.130
after the other. And here you can see that with a 384 well plate, the read
72
00:05:41.190 --> 00:05:46.531
heads and the center of the microplate are not properly aligned to start with.
73
00:05:46.620 --> 00:05:52.470
So by adjusting the cursor to the center of the microplate, we are readjusting
74
00:05:52.500 --> 00:05:57.660
the read head. When this is finished, a window will appear showing the new name for
75
00:05:57.690 --> 00:06:02.400
the microplate and the offset updated dimensions. Click Save.
76
00:06:03.300 --> 00:06:07.500
The next window is for the Z-height optimization, and you will be able to choose
77
00:06:08.100 --> 00:06:09.810
any well of the microplate.
78
00:06:11.820 --> 00:06:17.370
Click on Next. The optimization wizard will start and will take only 30
79
00:06:17.400 --> 00:06:23.040
seconds. This will optimize onto the volume of liquid you've got into the
80
00:06:23.100 --> 00:06:28.800
microplate. So you need to do that every time you change volume, or you can do that
81
00:06:29.640 --> 00:06:32.880
before every read if you can spare those 30 seconds.
82
00:06:35.100 --> 00:06:40.890
You will then have the optimized read height that has been found, and
83
00:06:41.010 --> 00:06:43.651
you can click on Save.
84
00:06:48.841 --> 00:06:52.651
Then you have the option to read the plate, and you will carry on reading the plate
85
00:06:52.710 --> 00:06:57.690
with all the optimization. Or if you click Cancel, the optimization will be saved.
86
00:06:58.561 --> 00:07:04.440
And you can see here in the right of the plate that you got the
87
00:07:04.470 --> 00:07:08.490
optimized wavelengths, the new plate, and the optimized height.
88
00:07:09.151 --> 00:07:13.800
You can then save this as a protocol file, so you can open this with all the
89
00:07:13.860 --> 00:07:16.170
optimization when you read your assay.
90
00:07:17.820 --> 00:07:21.420
Thank you for your attention.
Related products
Request Quote for All Products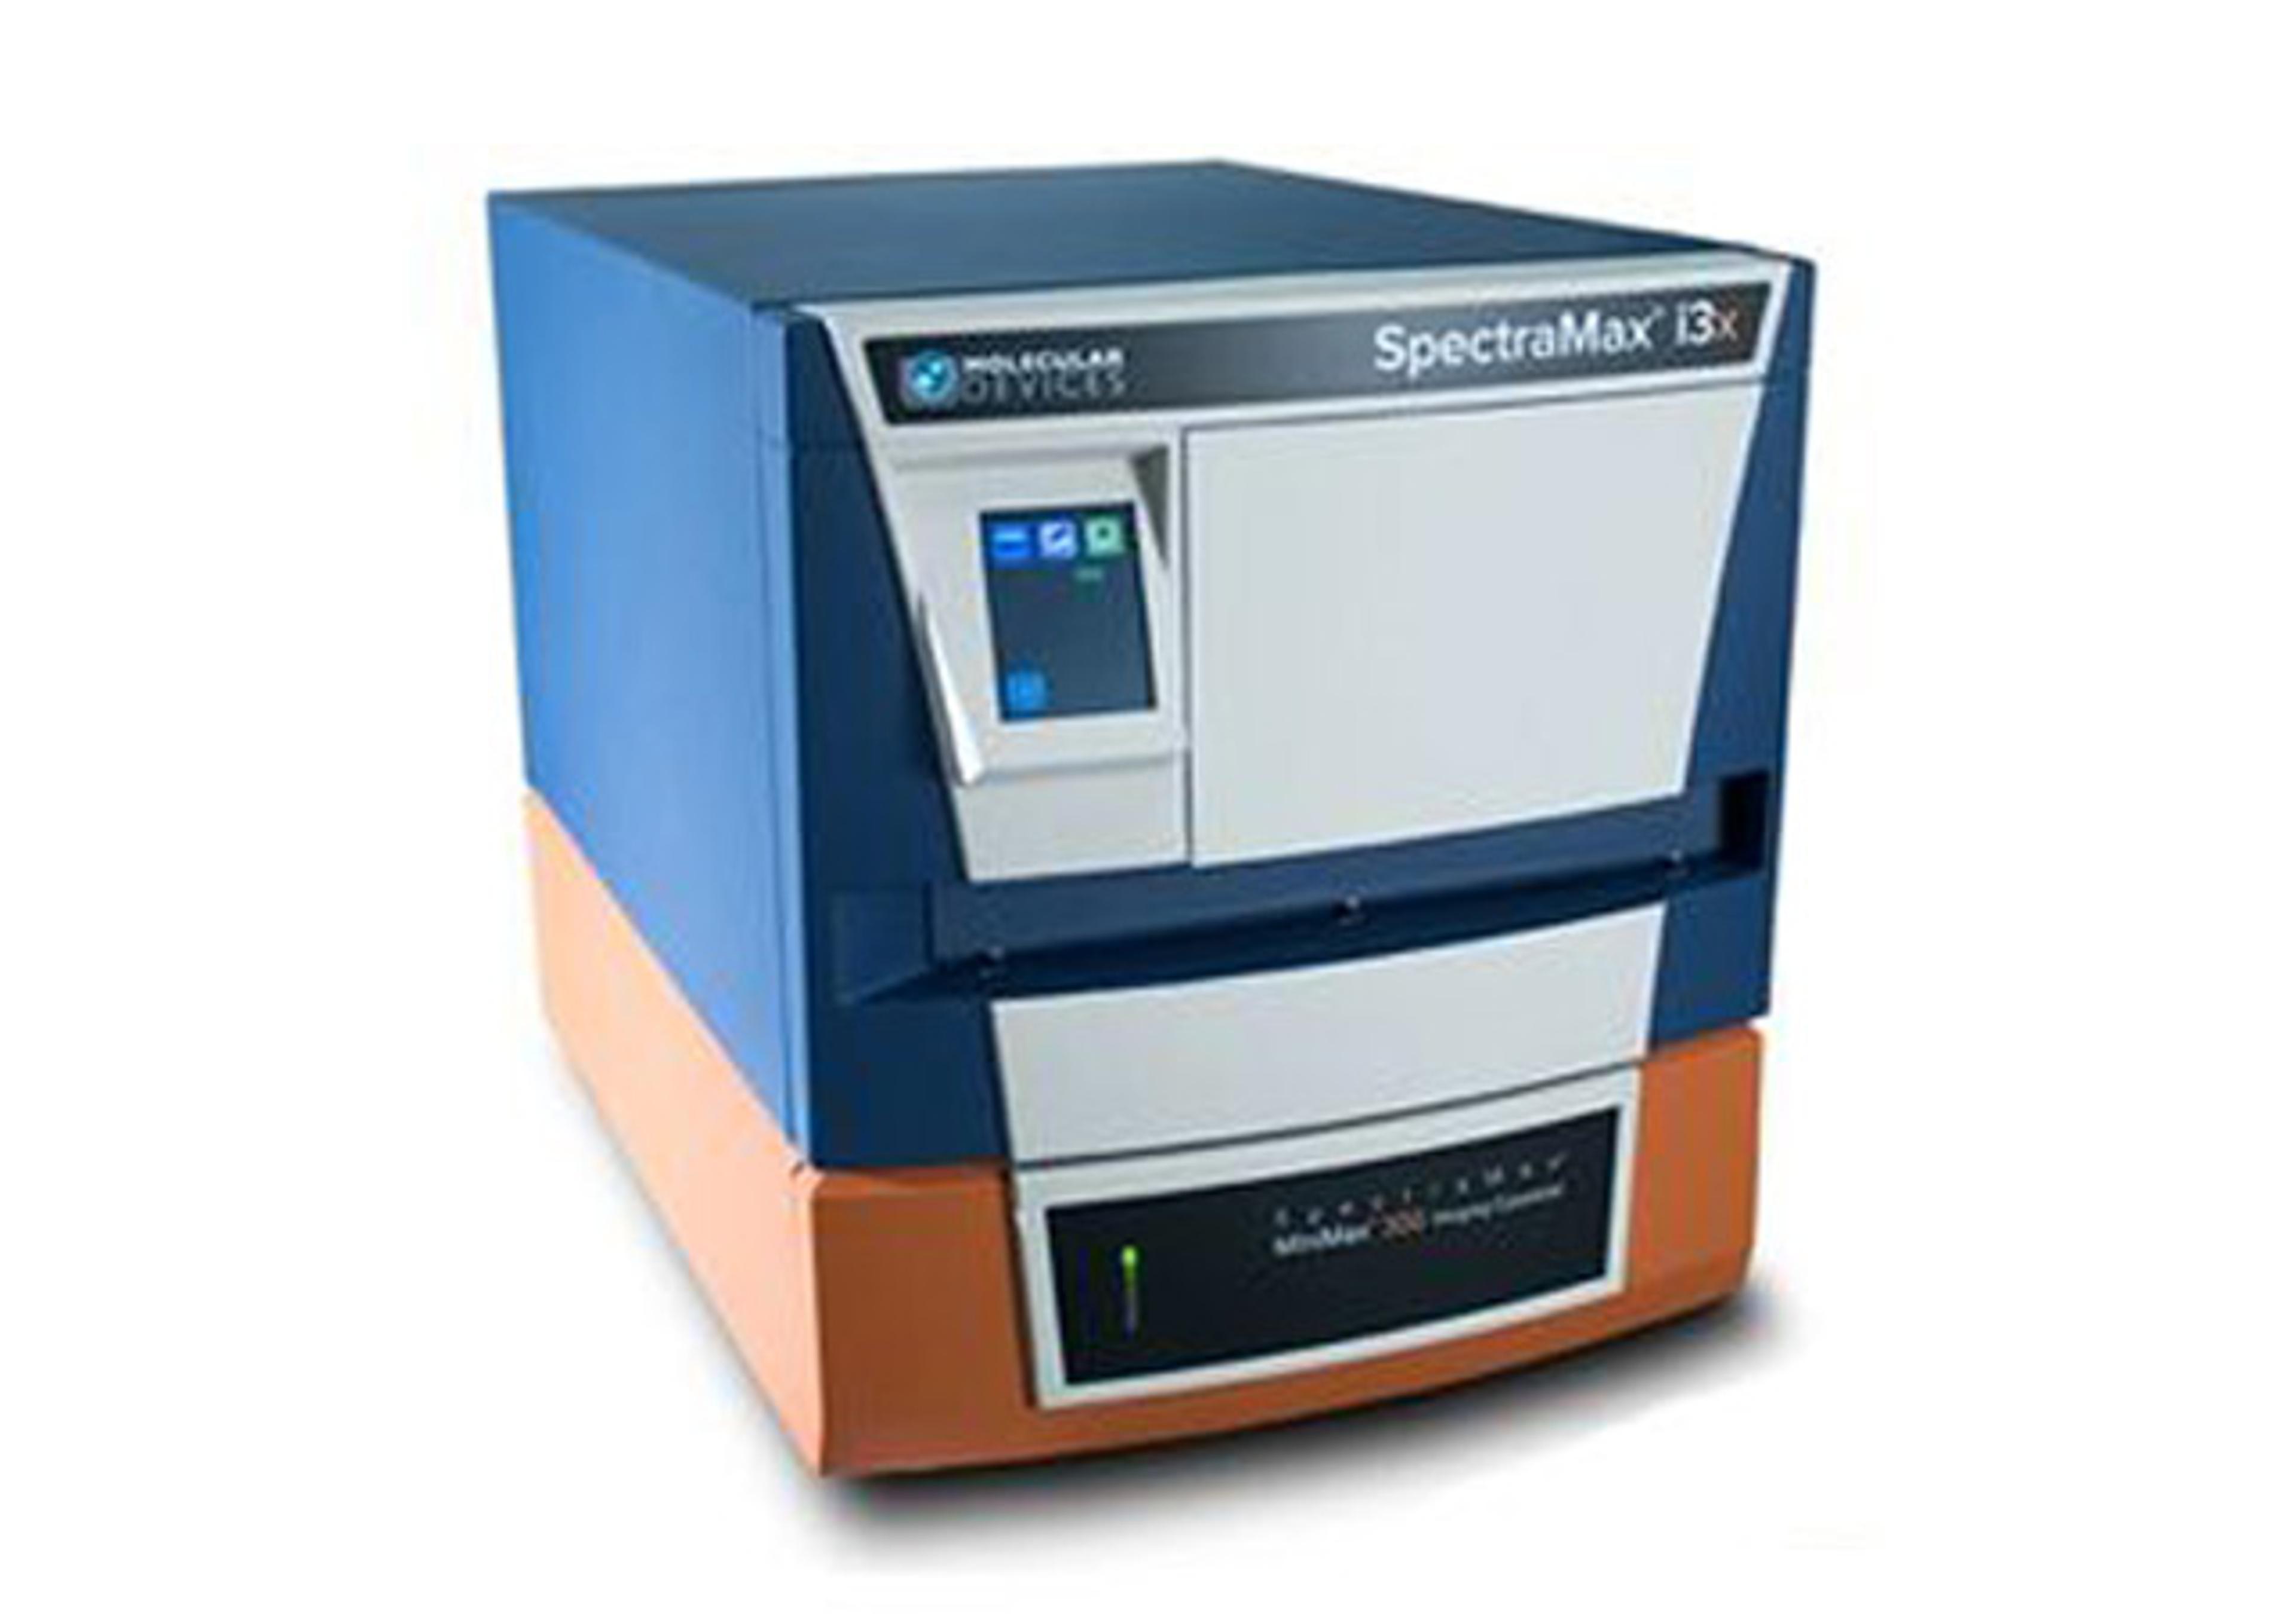
SpectraMax i3x Multi-Mode Microplate Reader with MiniMax Imaging Cytometer
Molecular Devices®Measures Absorbance, Fluorescence, and Luminescence with the added functionality of modular upgrades
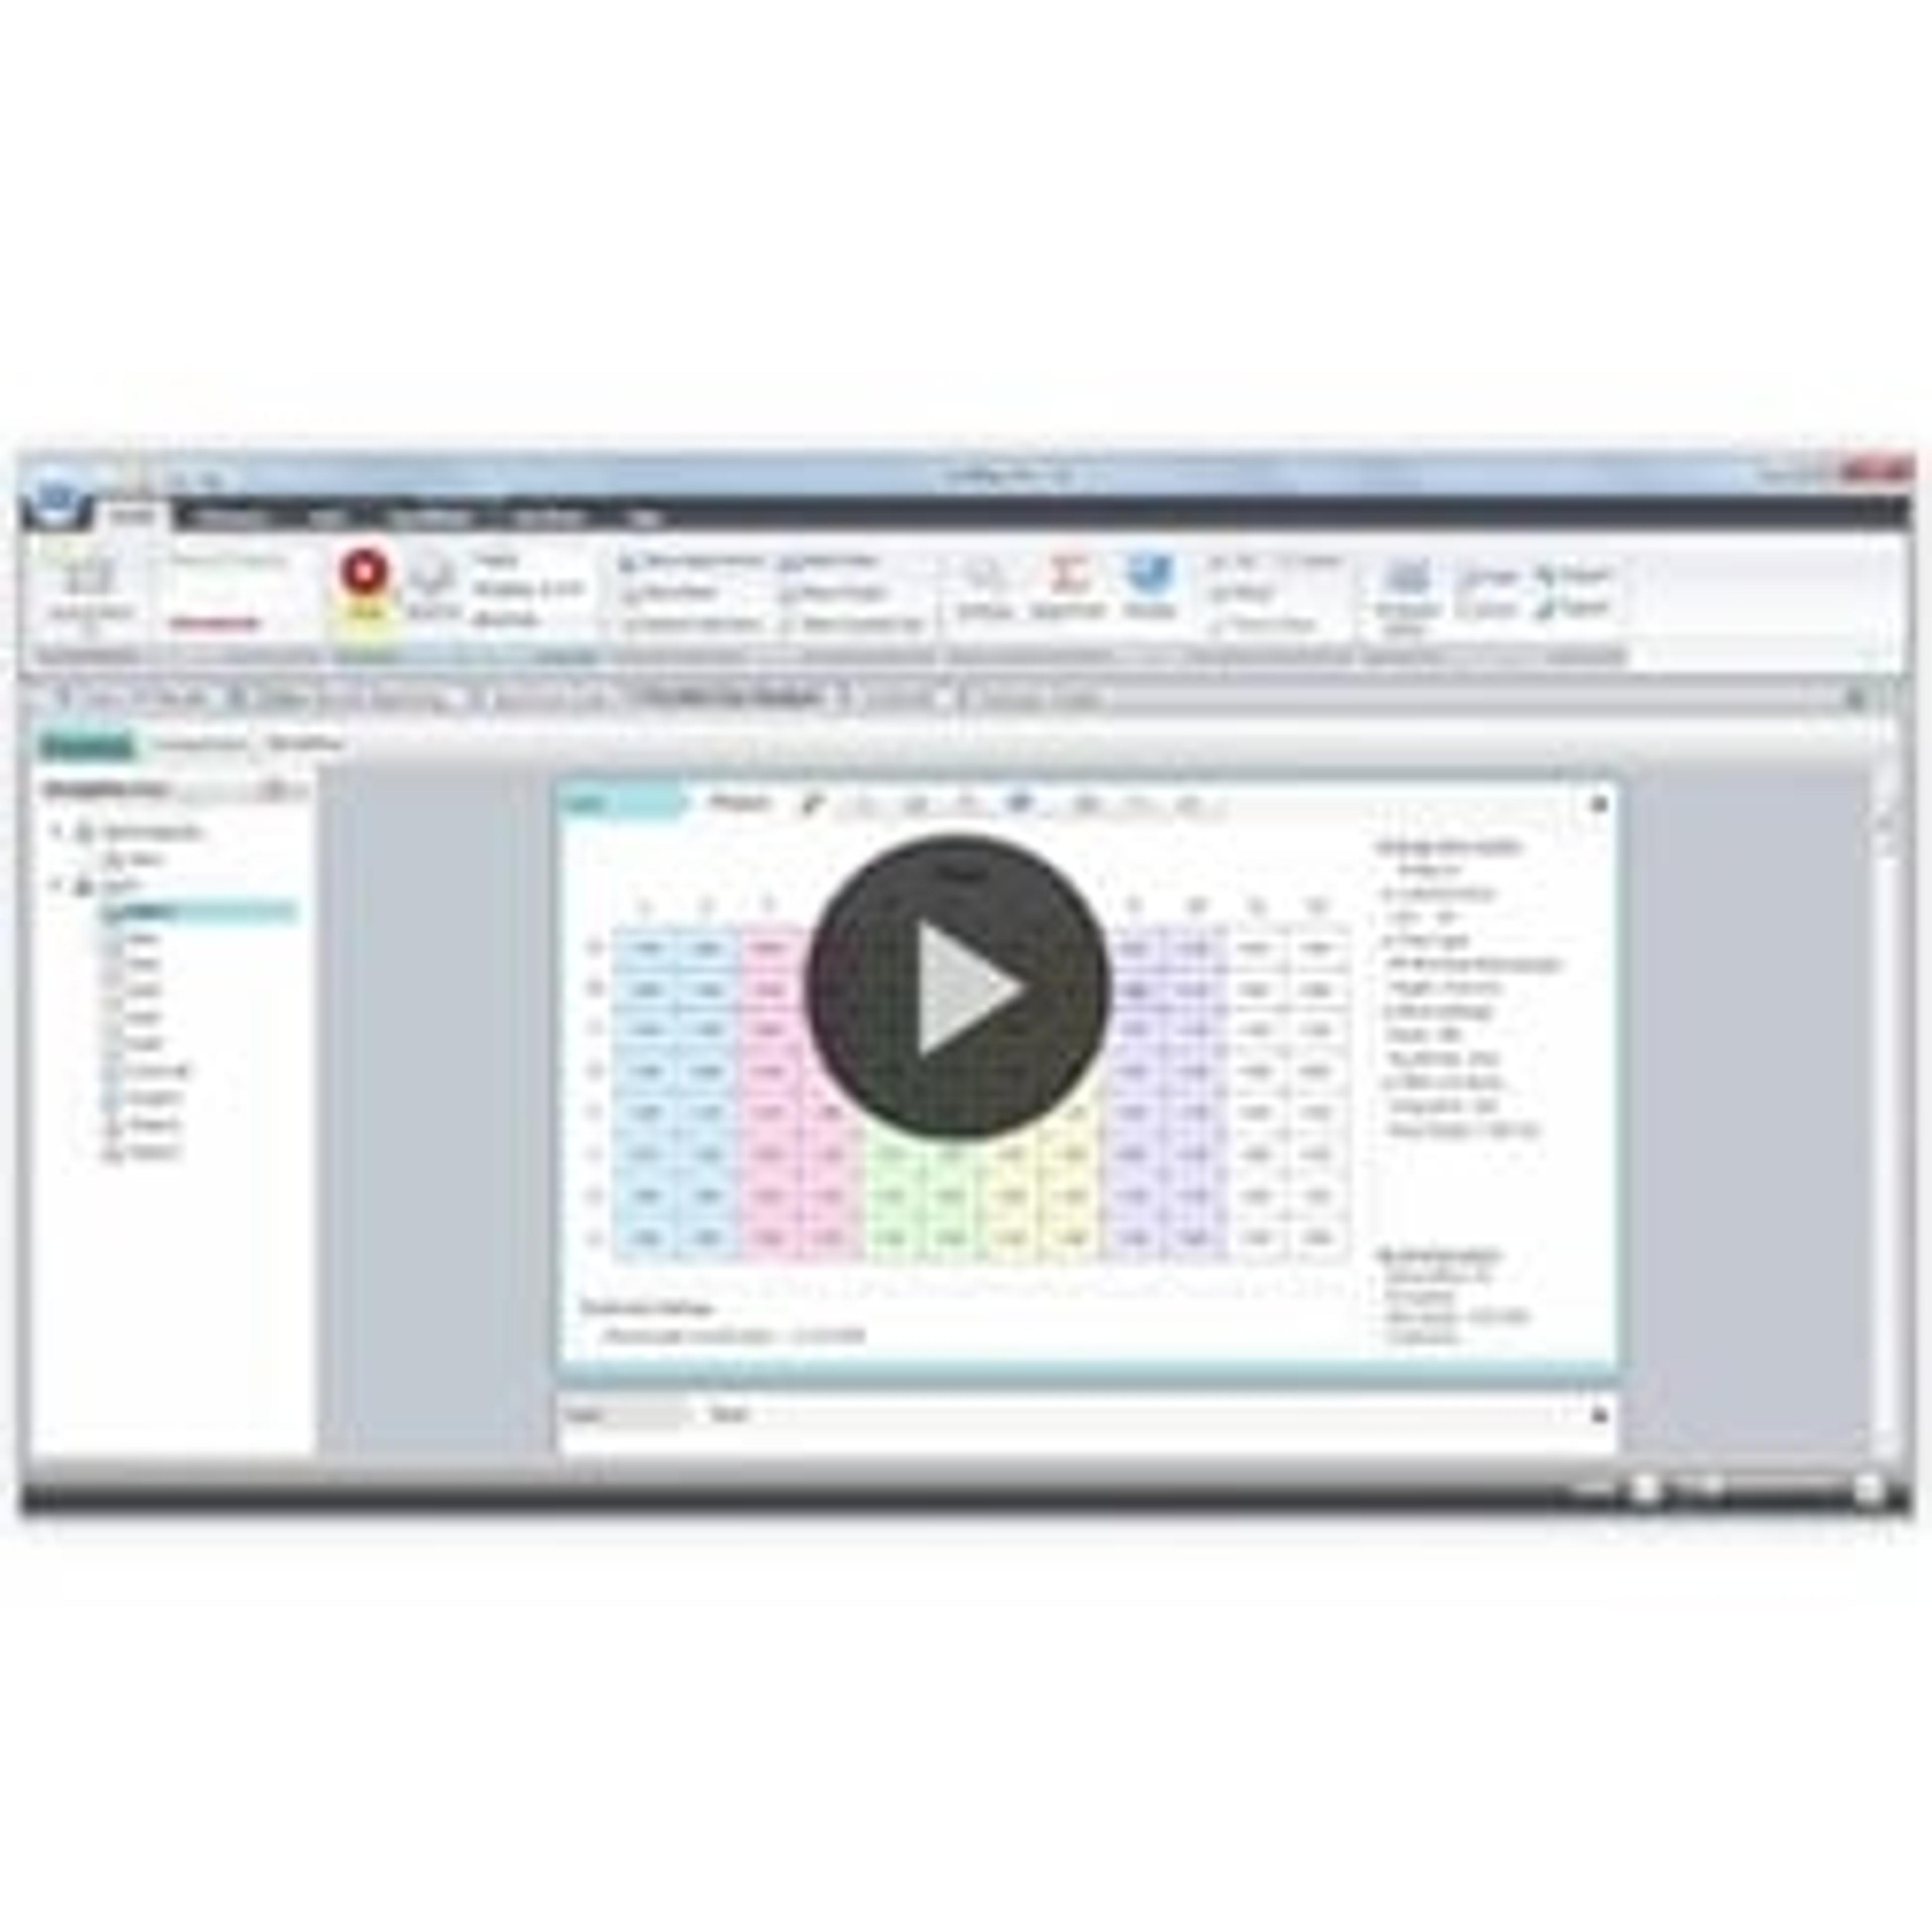
SoftMax® Pro Microplate Data Acquisition & Analysis Software
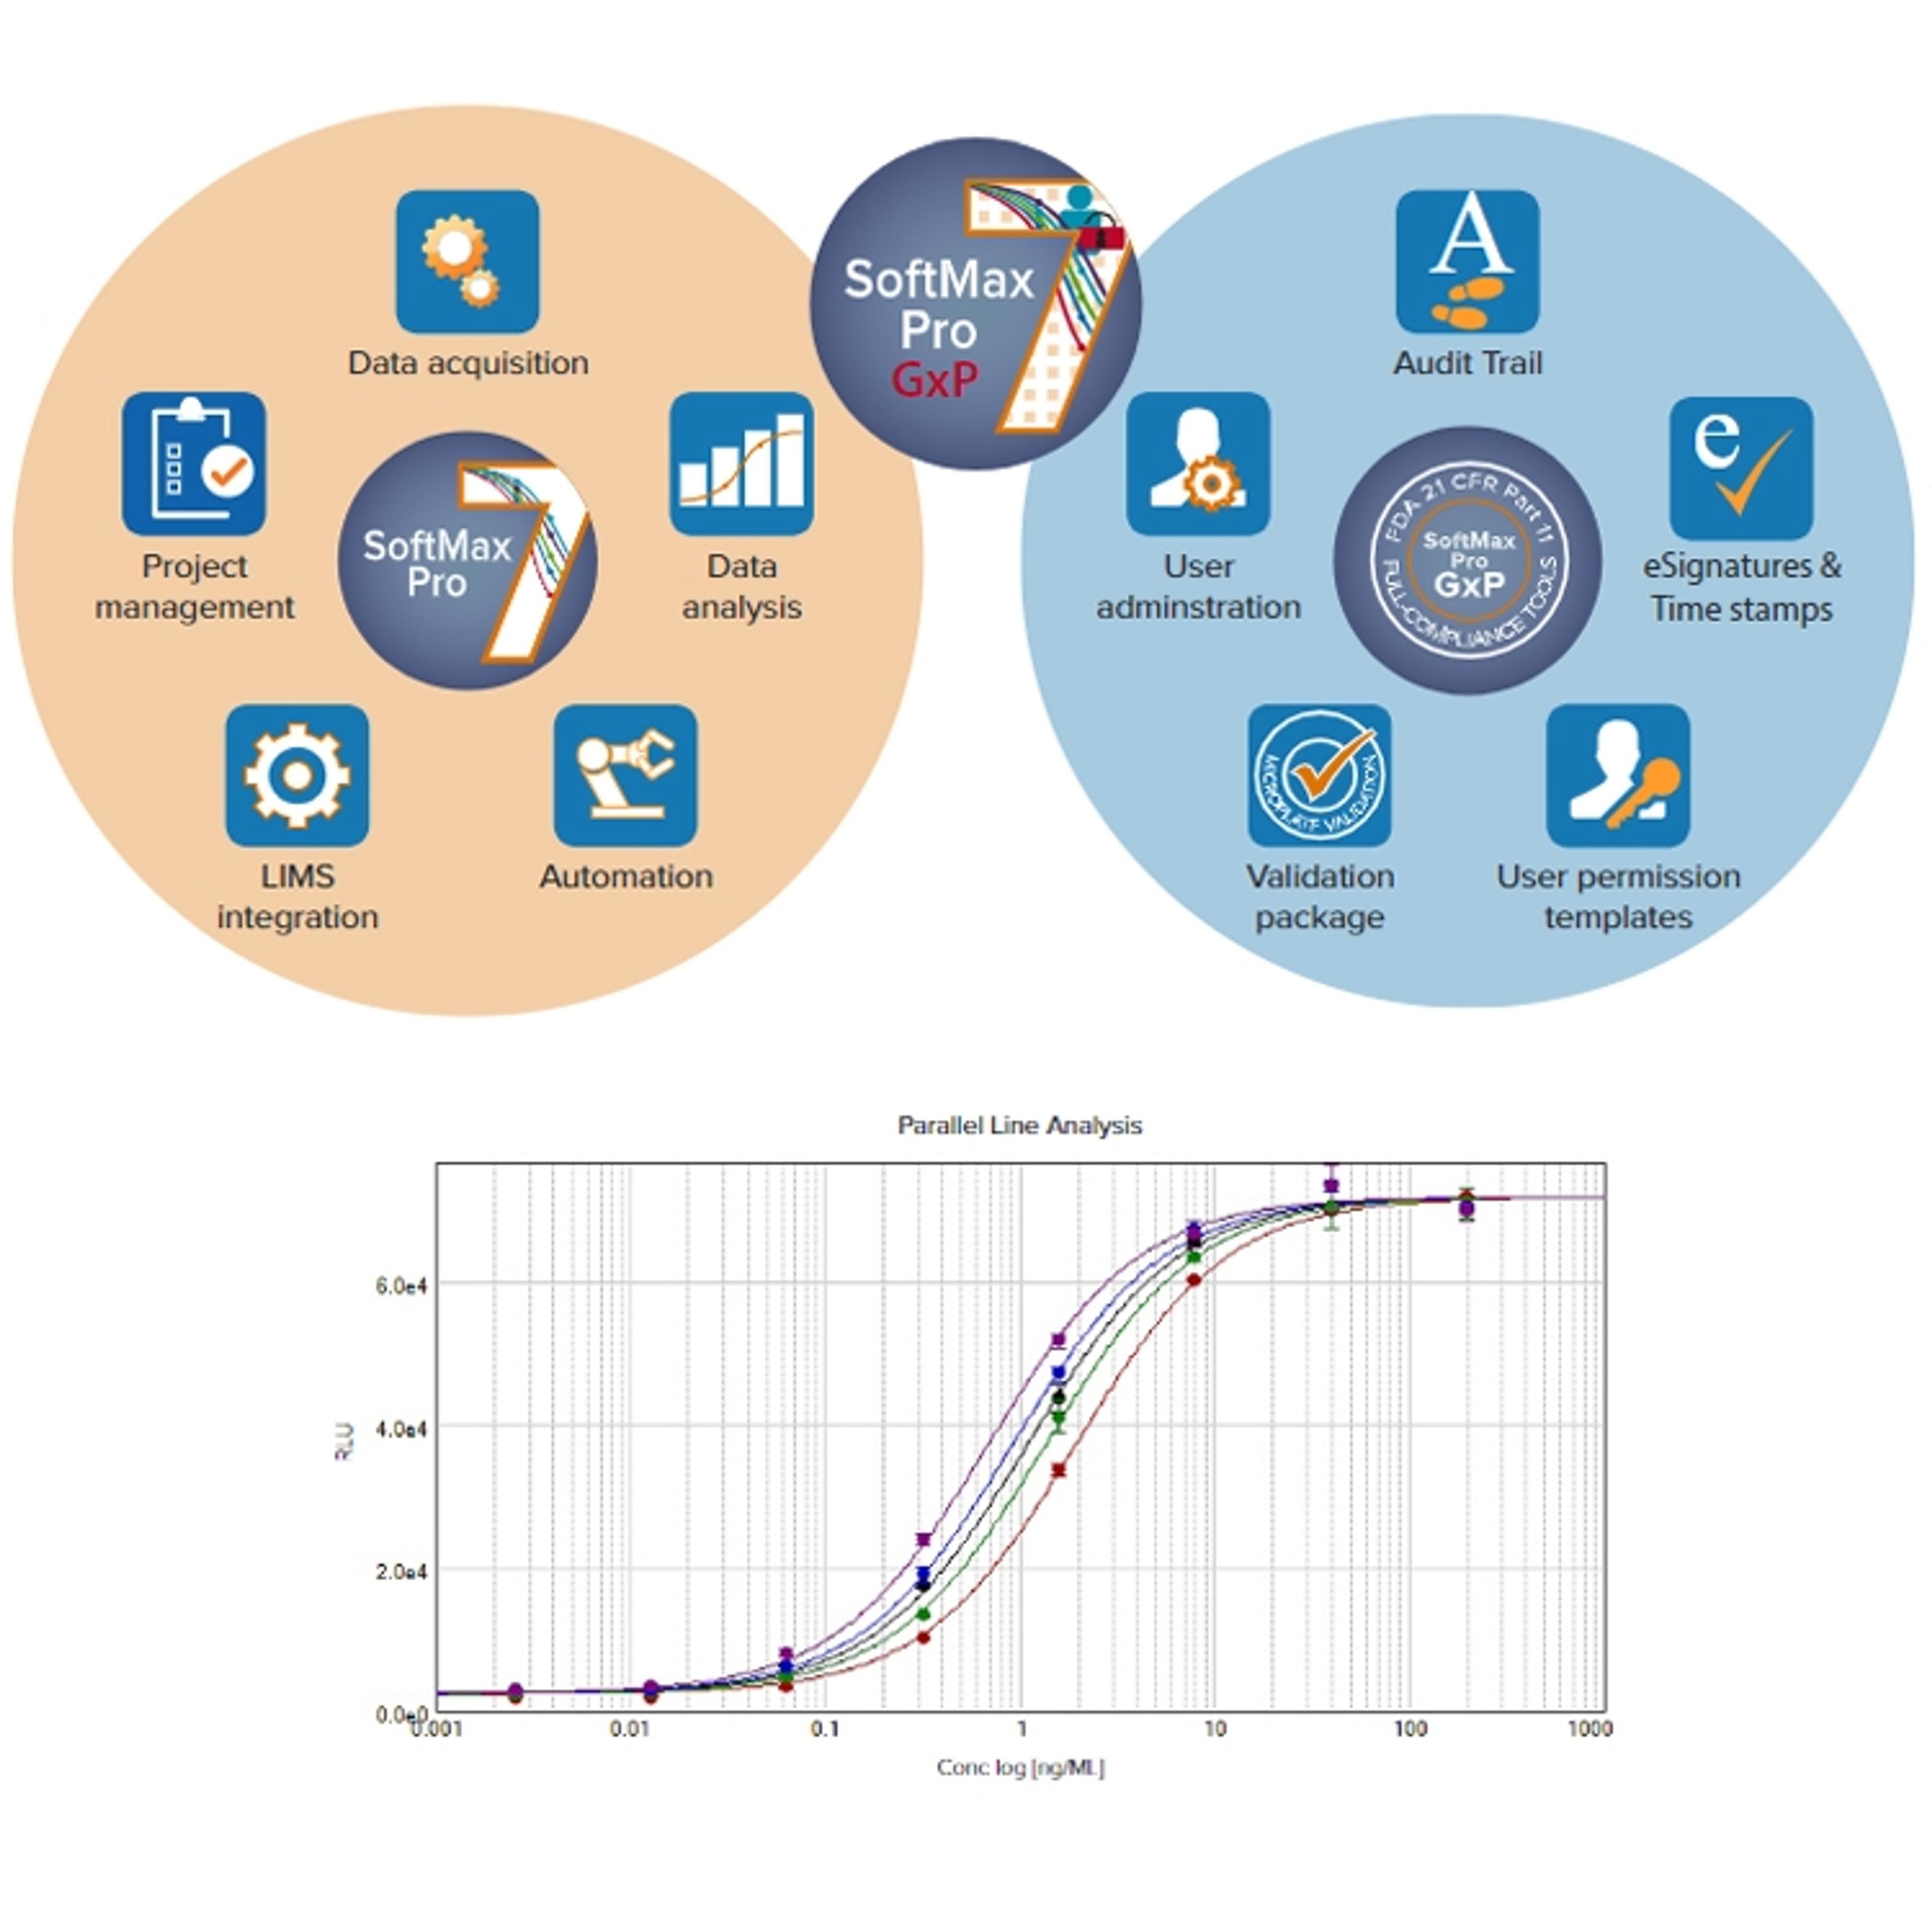
Molecular Devices®SoftMax ® Pro Software is designed to provide the simplicity, flexibility and power required for advanced data analysis. It provides ready-to-run protocols, analysis algorithms, and 21 different curve fit options. Every step has been optimized for data acquired from a Molecular Devices microplate reader or data imported from another source to simplify analysis and reporting. FDA 21 CFR Part 11 compliance tools are available for regulated laboratories providing end-to-end chain of custody.
SoftMax® Pro GxP Software
Molecular Devices®Meet FDA guidelines in GMP/GLP labs with complete validation tools