Adapting your laboratory microplate reader for bacterial endotoxin testing
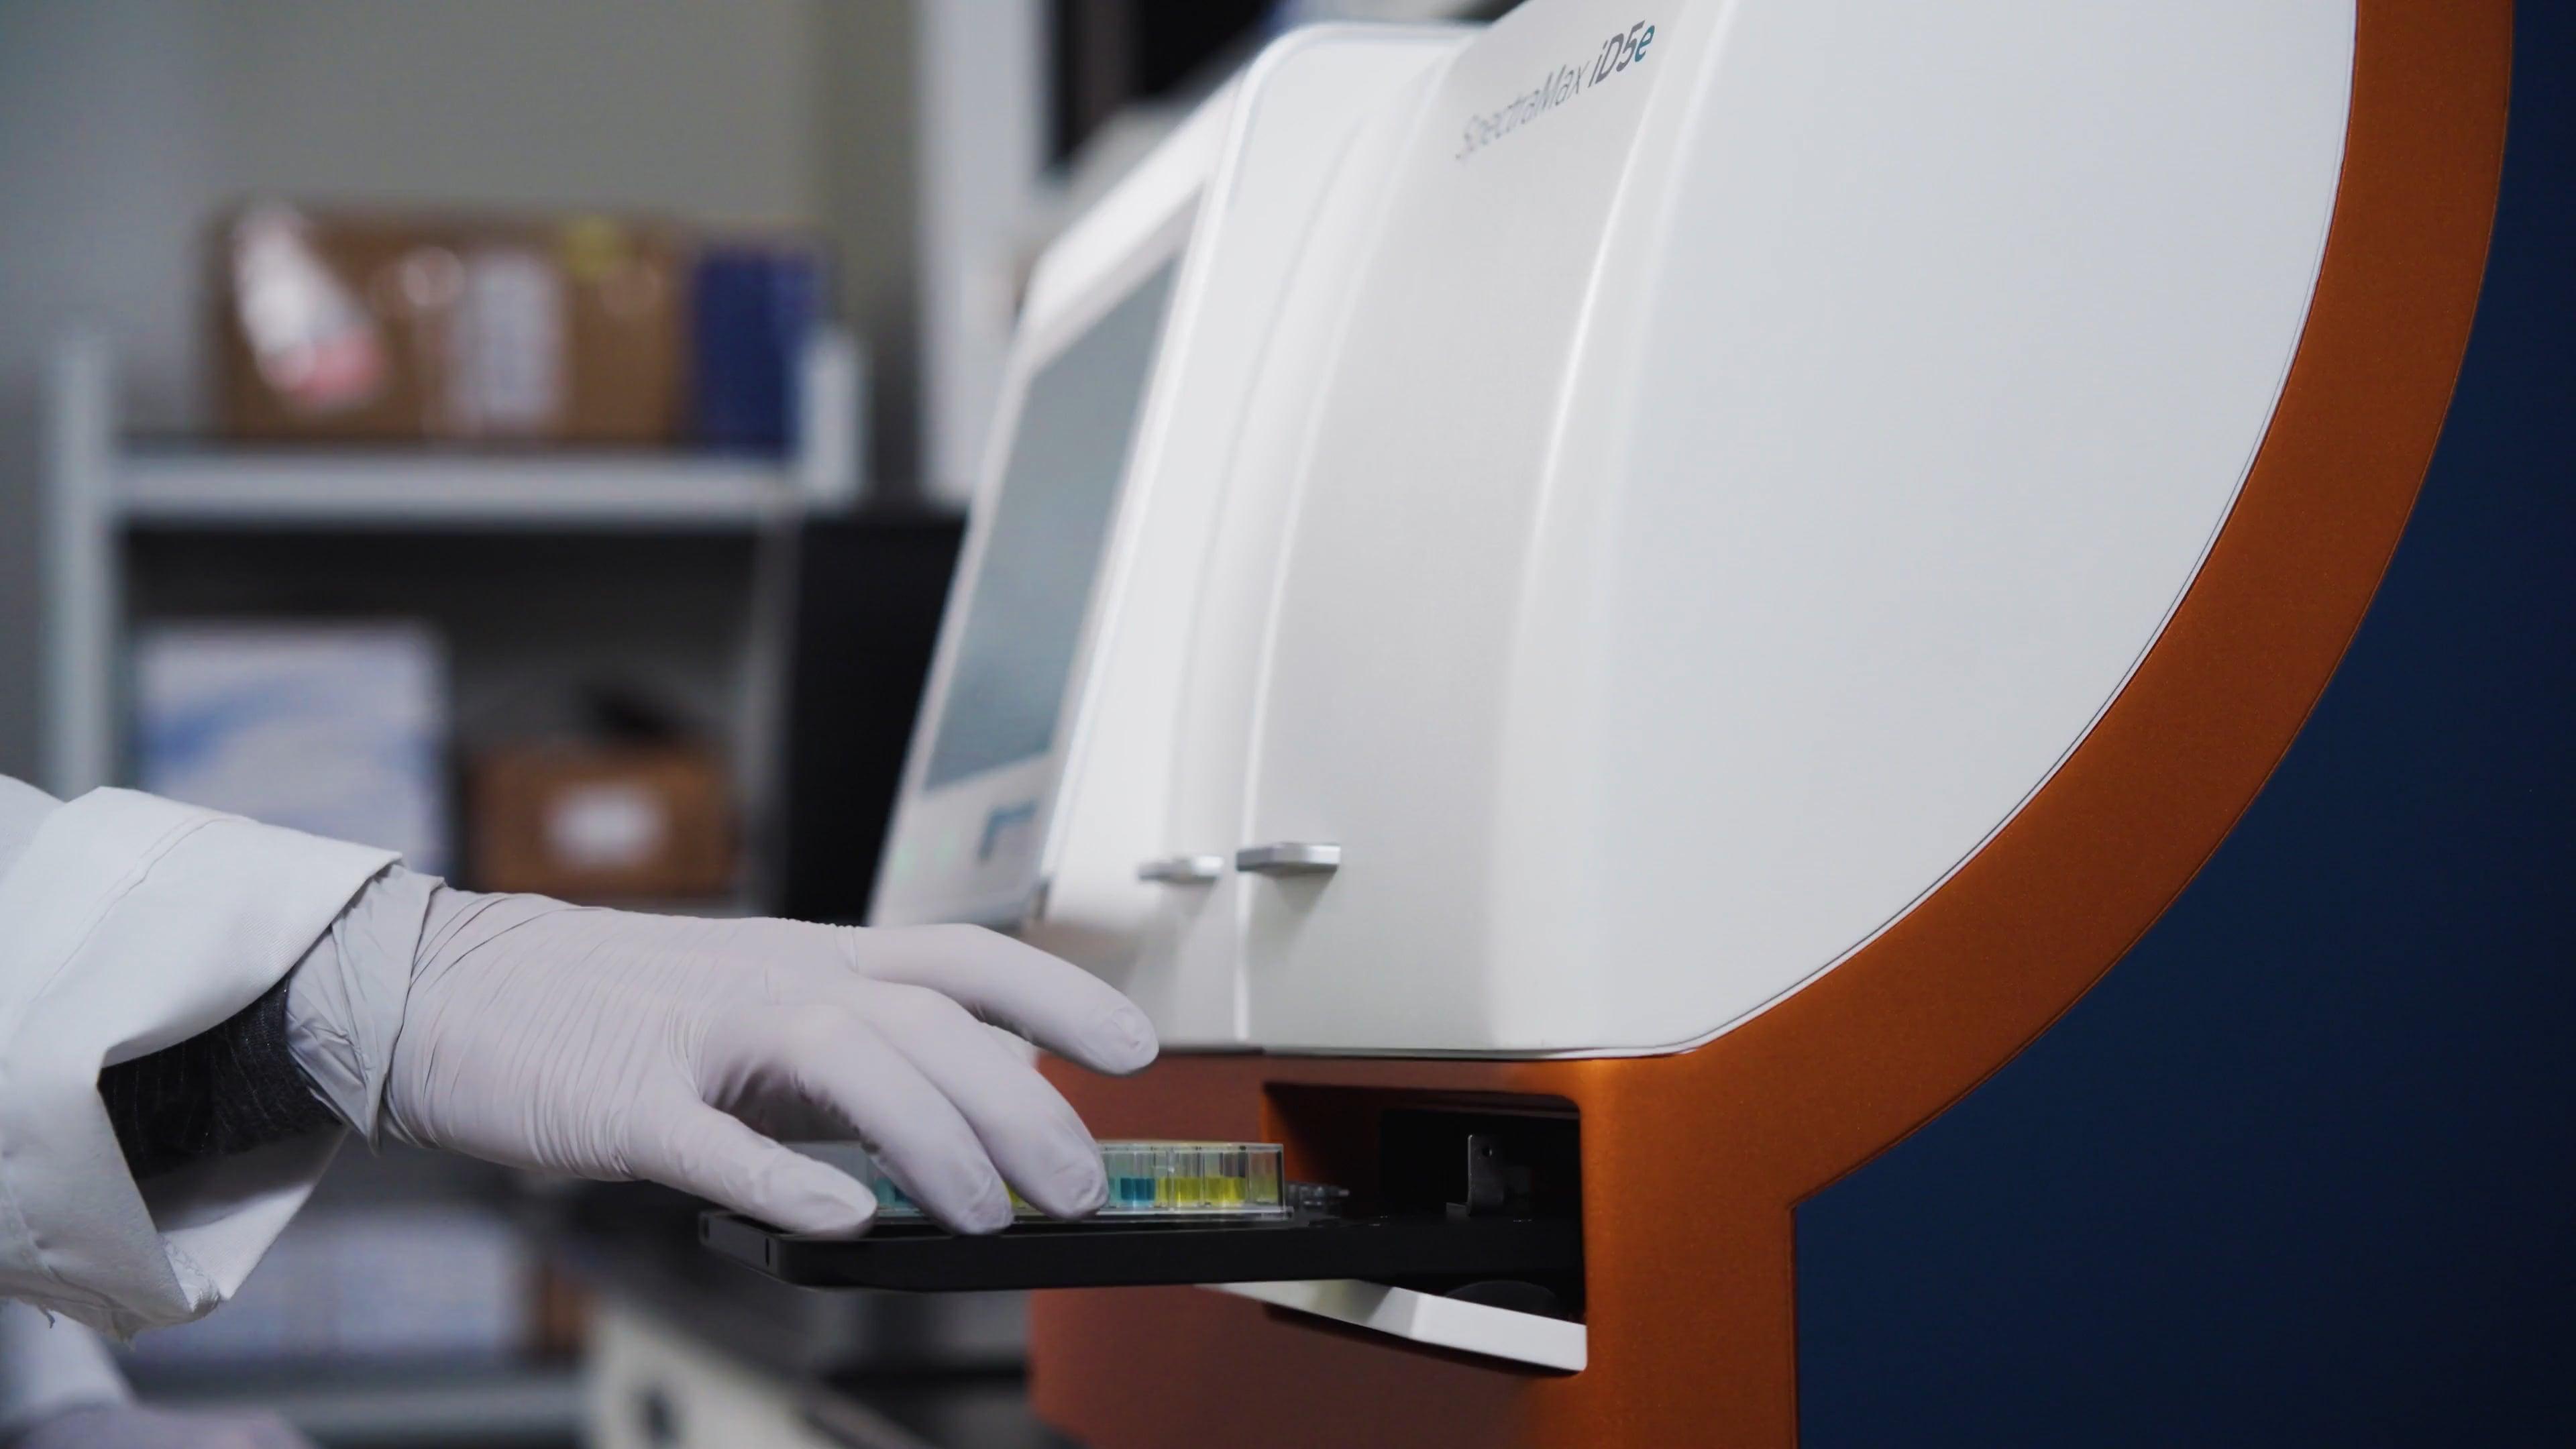
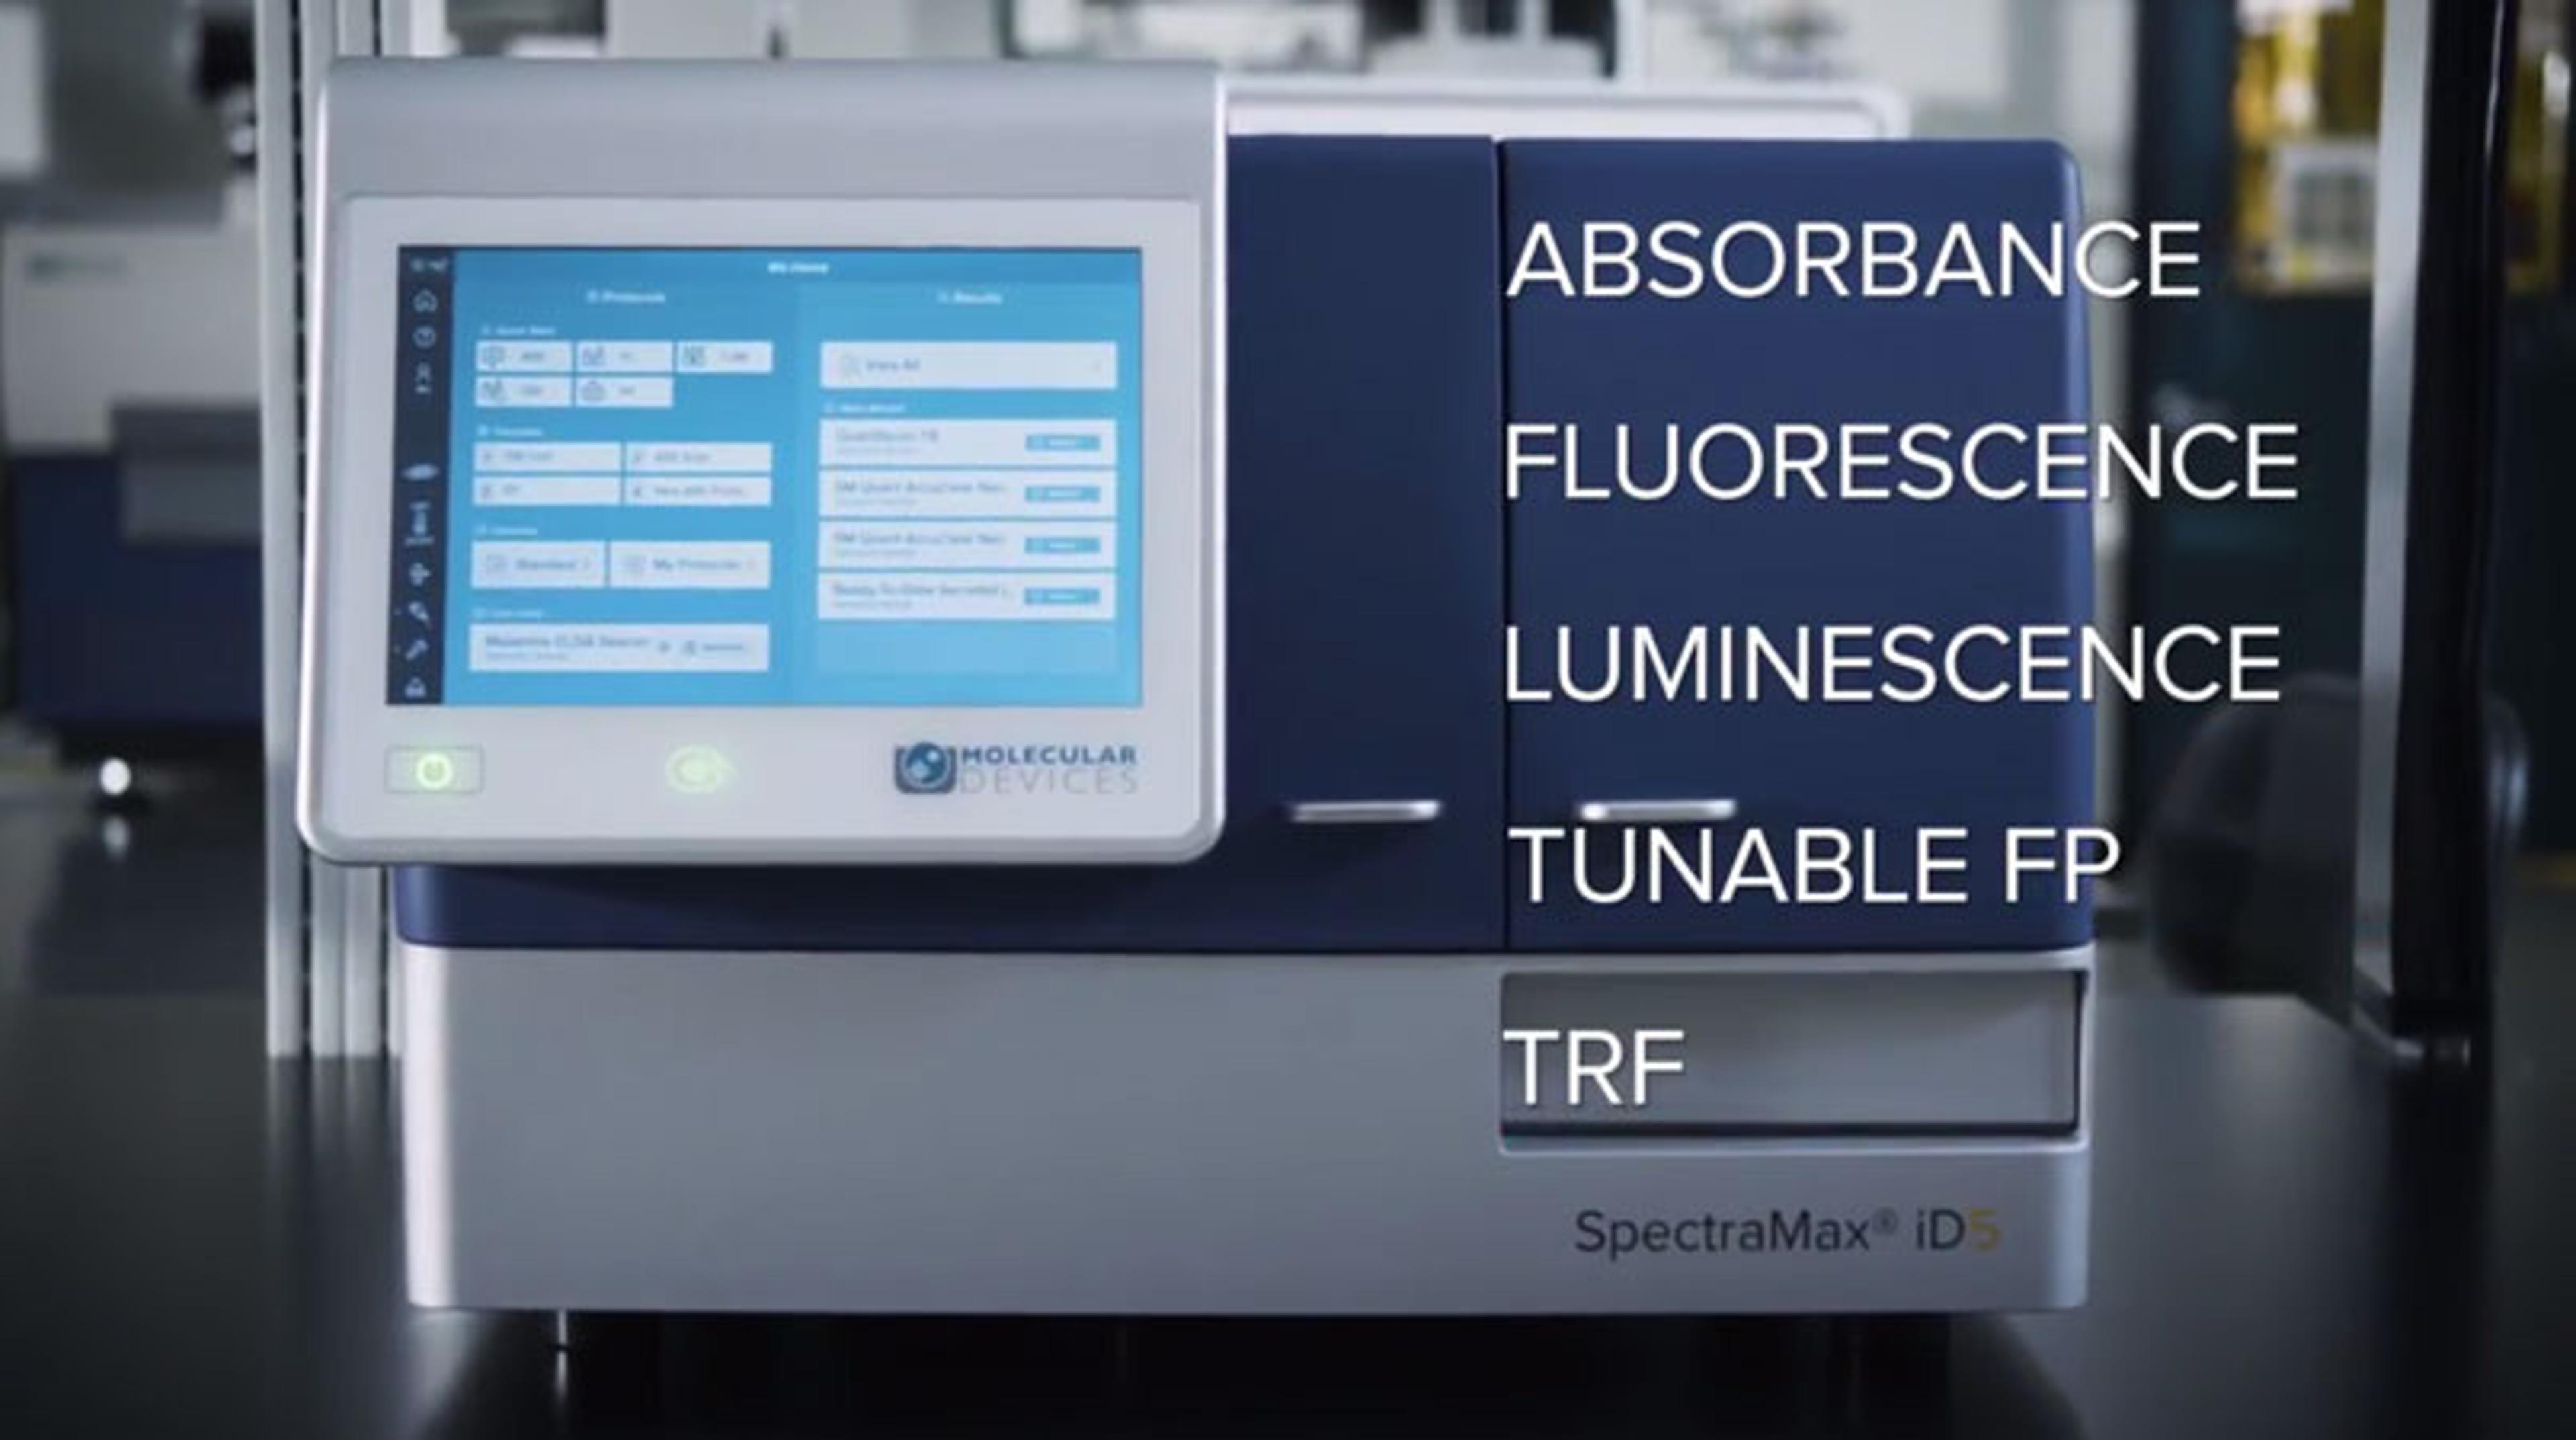
11 Sept 2026This video provides a comprehensive overview of the Bacterial Endotoxin Test (USP <85>), presented by Timothy Francis of Fujifilm Wako Chemicals. It details the three LAL methodologies, essential testing parameters, and FUJIFILM Wako's kinetic reagents. Cathy Olsen from Molecular Devices® then highlights SpectraMax® Microplate Readers and SoftMax Pro® Software, explaining the details of the software protocol itself, especially focusing on the data compatibility in terms of data compliance with CFR and FDA GMP guidelines.
Discover how Fujifilm Wako Chemicals' endotoxin test reagents, in concert with Molecular Devices' SpectraMax microplate readers and the SoftMax Pro software that powers them, are a fully validated solution for your bacterial endotoxin testing.
About the company

Molecular Devices®
Molecular Devices is one of the world’s leading providers of high-performance bioanalytical measurement systems, software and consumables for life science research, pharmaceutical and biotherapeutic development. Included within a broad product portfolio are platforms for high-throughput screening, genomic and cellular analysis, colony selection and microplate detection. These leading-edge products enable scientists to improve productivity and effectiveness, ultimately accelerating research and the discovery of new therapeutics. Molecular Devices is committed to the continual development of innovative solutions for life science applications. The company is headquartered in Silicon Valley, California, with offices around the globe. For more information, please visit www.moleculardevices.com.
General Inquiry - USA & Canada: +1 800-635-5577 General Inquiry - Europe: 00800 665 32860 Sales +1 877-589-2214 Support +1 800 635 5577
Video transcript
Show transcript
1
00:00:02.250 --> 00:00:04.051
Hello, my name is Timothy Francis.
2
00:00:04.110 --> 00:00:09.541
I'm the senior technical specialist for Fujifilm Wako Chemicals USA Corporation,
3
00:00:10.110 --> 00:00:15.150
and I'm excited to be providing this portion of this presentation on
4
00:00:15.255 --> 00:00:20.070
adapting your laboratory microplate reader for bacterial endotoxin
5
00:00:20.130 --> 00:00:26.100
testing with molecular devices. I'm going to be presenting
6
00:00:26.161 --> 00:00:32.131
to you an overview of the bacterial endotoxin test, as well as some of the studies
7
00:00:32.220 --> 00:00:36.481
we've done with the reader in the performance with our reagent.
8
00:00:39.360 --> 00:00:43.140
First, I'd like to talk about what the bacterial endotoxin test is.
9
00:00:44.100 --> 00:00:49.845
Here we see the USP85, the bacterial endotoxin test is the title of this
10
00:00:49.890 --> 00:00:55.620
slide. USP Chapter 85 outlines for us the bacterial endotoxin test
11
00:00:55.651 --> 00:01:00.720
with what is called the Limulus amebocyte lysate reagent, which is what our company
12
00:01:00.780 --> 00:01:06.390
manufactures. There are three techniques listed in USP85 for the
13
00:01:06.450 --> 00:01:11.970
bacterial endotoxin test. Now, this chapter is also harmonized with the European
14
00:01:12.030 --> 00:01:14.910
Pharmacopeia and Japanese Pharmacopeias as well.
15
00:01:15.705 --> 00:01:18.900
The first methodology is called the gel clot technique.
16
00:01:20.250 --> 00:01:25.711
This measures endotoxin by the presence of gel formation after cleavage of peptide
17
00:01:25.770 --> 00:01:30.240
bonds within coagulogen to yield coagulin.
18
00:01:31.140 --> 00:01:36.705
You can see the LAL cascade that I've illustrated here, showing the
19
00:01:36.840 --> 00:01:42.780
reaction that takes place with these protein factors when endotoxin
20
00:01:42.810 --> 00:01:48.601
is introduced. So the gel clot technique is literally just reacting
21
00:01:48.780 --> 00:01:54.180
LAL reagent with a sample in a test tube after incubation of one hour.
22
00:01:55.080 --> 00:02:00.480
At that point, the test tube is inverted and a positive test is recorded if
23
00:02:00.570 --> 00:02:06.450
that solution is clotted and remains at the top of the test tube.
24
00:02:06.510 --> 00:02:12.465
At that point, we would say that that sample has endotoxin, at least at the labeled
25
00:02:12.540 --> 00:02:17.310
sensitivity of the reagent. You can see this as a qualitative method.
26
00:02:17.370 --> 00:02:22.800
It only gives a positive or negative result at a specific sensitivity.
27
00:02:22.815 --> 00:02:28.005
The turbidimetric and chromogenic techniques, however, are quantitative methods in
28
00:02:28.050 --> 00:02:32.910
that they will allow a standard curve to produce definite endotoxin results.
29
00:02:33.900 --> 00:02:38.700
Now, the turbidimetric method has a measurement principle very similar to the gel
30
00:02:38.790 --> 00:02:43.740
clot method. In fact, our reagent is licensed to perform either method.
31
00:02:45.465 --> 00:02:51.360
But the turbidimetric method involves an absorbance reader
32
00:02:51.660 --> 00:02:55.020
measuring the onset of turbidity of that reagent.
33
00:02:55.410 --> 00:03:00.810
In contrast, we also manufacture chromogenic reagent in which a chromogenic
34
00:03:00.870 --> 00:03:06.570
substrate has been added to the reagent to measure the onset of this
35
00:03:06.601 --> 00:03:10.995
clotting enzyme more effectively using an absorbance reader.
36
00:03:11.700 --> 00:03:17.281
So these are the three general methods that the USP85 outlines in the bacterial
37
00:03:17.310 --> 00:03:21.451
endotoxin test, and we're going to be looking specifically at turbidimetric and
38
00:03:21.480 --> 00:03:22.800
chromogenic methods.
39
00:03:24.630 --> 00:03:30.570
Now, we're going to look at what the USP85 requirements of a quantitative method
40
00:03:30.585 --> 00:03:33.330
are, specifically of the reader itself.
41
00:03:33.451 --> 00:03:36.914
The reader needs to be a photometric incubating reader.
42
00:03:37.410 --> 00:03:42.675
It needs to be capable of measuring a negative control without activation.
43
00:03:42.690 --> 00:03:47.010
This may be stating the obvious, but of course, a negative control is supposed to
44
00:03:47.070 --> 00:03:51.840
be there to ensure that the environment is free of contamination.
45
00:03:51.930 --> 00:03:57.046
So only activation of the negative control should come about by
46
00:03:57.090 --> 00:04:02.460
the sample that we are attempting to measure, in which case would be
47
00:04:02.550 --> 00:04:08.101
endotoxin. Then whatever regression is used for the
48
00:04:09.330 --> 00:04:14.190
standard curve regression, the correlation coefficient must be greater than or
49
00:04:14.250 --> 00:04:19.710
equal to 0.980. Of course, if it's negative, it should be less than that.
50
00:04:20.010 --> 00:04:24.480
Basically, the absolute value of that correlation coefficient should be greater
51
00:04:24.540 --> 00:04:30.300
than 0.980. Samples must be tested with a positive product control
52
00:04:30.315 --> 00:04:35.310
spiked at or near the midpoint of the standard curve, and then measured positive
53
00:04:35.341 --> 00:04:41.220
product control results must lie within 50% to 200% of a true value.
54
00:04:41.281 --> 00:04:46.664
Now, many errors, whether that's technical, user, environmental,
55
00:04:47.250 --> 00:04:51.900
as well as product interference itself, could all come into the variability of the
56
00:04:51.960 --> 00:04:57.855
assay. So this 50% to 200% range, you can think of as the resolution of the test,
57
00:04:57.960 --> 00:05:03.720
but in a sense, it's that catch-all variability we allow for this biological
58
00:05:03.930 --> 00:05:04.531
assay.
59
00:05:06.570 --> 00:05:11.160
Now, all of our reagents are kinetic reagents.
60
00:05:11.370 --> 00:05:13.951
We measure them using kinetic methods.
61
00:05:14.400 --> 00:05:19.500
There are endpoint endotoxin reagents out there in which incubation takes place
62
00:05:19.560 --> 00:05:22.890
over a set amount of time, and then one measurement is taken.
63
00:05:23.460 --> 00:05:29.160
However, we use kinetic measurements for both our chromogenic and our
64
00:05:29.190 --> 00:05:35.160
turbidimetric techniques. Some of the advantages of this are there's no need
65
00:05:35.220 --> 00:05:40.951
to take the time yourself, at which point a plate would need a stop reagent
66
00:05:41.100 --> 00:05:47.010
added and then a measurement taken place, as well as a kinetic method allows for
67
00:05:47.100 --> 00:05:51.870
a wide standard curve range. And I visualize that here for you.
68
00:05:52.560 --> 00:05:58.201
First, you'll notice the negative control remains unreactive above our threshold
69
00:05:58.380 --> 00:06:03.660
OD, optical density. That's set at 0.015 for our reagent.
70
00:06:04.230 --> 00:06:08.730
Basically, that's the threshold at which an activation time is recorded.
71
00:06:09.360 --> 00:06:15.060
You can see I have four concentrations ranging from five to 0.05 EU per
72
00:06:15.210 --> 00:06:20.640
ml, that's just endotoxin units per milliliter, that have an activation time.
73
00:06:21.960 --> 00:06:27.826
So we have a measure of concentration that gives us a measure of activation time,
74
00:06:28.201 --> 00:06:32.670
and from those values, we can create a standard curve.
75
00:06:33.331 --> 00:06:38.701
Now, any regression is allowed by the Pharmacopeial standards, but our reagent
76
00:06:38.760 --> 00:06:42.510
specifically, we use a log-log linear reduction
77
00:06:43.710 --> 00:06:47.655
for the regression of that standard curve. So you can see that here.
78
00:06:47.670 --> 00:06:53.430
Basically, on a logarithmic graph, you see the CSE concentration on the
79
00:06:53.670 --> 00:06:59.341
x-axis, the onset time on the y-axis, and you can see the absolute value of
80
00:06:59.370 --> 00:07:03.405
linear regression that we received from that.
81
00:07:04.651 --> 00:07:09.690
That's an overview of the kinetic measurement, and then based off of unknown
82
00:07:09.720 --> 00:07:15.360
samples' activation times, we're able to plug those values into the standard
83
00:07:15.420 --> 00:07:19.680
curve to get measures of the endotoxin concentration.
84
00:07:22.230 --> 00:07:28.140
I now want to give you an overview of our kinetic endotoxin testing
85
00:07:28.230 --> 00:07:33.811
reagents that we provide. First of all, the PyroStar-ESF plate reagent.
86
00:07:34.081 --> 00:07:39.660
This is a kinetic turbidimetric reagent, and we validate it to
87
00:07:40.081 --> 00:07:45.930
produce for you a standard curve from 10 to 0.01 endotoxin units
88
00:07:46.020 --> 00:07:51.660
per milliliter. We also manufacture the Limulus Color-KY reagent,
89
00:07:52.110 --> 00:07:54.870
which is our kinetic chromogenic reagent.
90
00:07:55.500 --> 00:08:01.020
You can see one of the advantages here is that the quantitative range
91
00:08:01.201 --> 00:08:06.990
is from five all the way down to 0.0005 endotoxin units
92
00:08:07.050 --> 00:08:07.920
per milliliter.
93
00:08:09.151 --> 00:08:13.140
Now, both of these are Limulus amebocyte lysate reagent.
94
00:08:13.530 --> 00:08:19.081
Both of these fit the definition of an endotoxin testing reagent according to
95
00:08:19.140 --> 00:08:24.526
USP85. However, the United States Pharmacopeia has just voted to
96
00:08:24.630 --> 00:08:29.070
include a new chapter on bacterial endotoxin testing.
97
00:08:29.130 --> 00:08:34.740
That's chapter 86, and this chapter allows for synthetic reagents to be
98
00:08:34.831 --> 00:08:40.651
used. So I've also included on here our PyroStar-Neo reagent, which is a completely
99
00:08:40.681 --> 00:08:45.901
synthetic reagent, but it's measured by the kinetic chromogenic technique.
100
00:08:46.350 --> 00:08:50.460
In fact, all of the settings are applicable among those two reagents.
101
00:08:52.320 --> 00:08:58.260
It has a quantitative range from 50 to 0.001 endotoxin
102
00:08:58.320 --> 00:08:59.520
units per milliliter.
103
00:09:01.806 --> 00:09:07.507
Now, the USP, as we mentioned, has some requirements for quantitative
104
00:09:07.596 --> 00:09:13.027
methods. However, we as well as the reagent manufacturer have set additional
105
00:09:13.116 --> 00:09:18.336
requirements in our package inserts for accurate measurement with our reagent.
106
00:09:18.726 --> 00:09:24.696
So we validate that our reagent will provide for you results that are within
107
00:09:24.726 --> 00:09:30.576
specification if you meet the testing parameters that we require
108
00:09:30.606 --> 00:09:32.556
for valid plate reader measurements.
109
00:09:33.096 --> 00:09:37.926
So you can see those listed here for our kinetic chromogenic and kinetic
110
00:09:37.986 --> 00:09:43.716
turbidimetric reagents. Nearly identical requirements for each incubation
111
00:09:43.806 --> 00:09:47.496
temperature of 37 degree Celsius throughout the read.
112
00:09:47.616 --> 00:09:52.640
Of course, assay mode of kinetic. I mentioned that threshold optical density of
113
00:09:52.896 --> 00:09:54.306
0.015.
114
00:09:55.566 --> 00:10:01.206
We ask that you perform a shake at the beginning of the protocol
115
00:10:01.296 --> 00:10:06.666
before the reads start. The shake often we recommend around 10 seconds on a medium
116
00:10:06.816 --> 00:10:12.516
constant speed. Measurement wavelength is where these two methods do
117
00:10:13.926 --> 00:10:19.206
diverge from each other. Both require a measurement at 405
118
00:10:19.266 --> 00:10:24.996
nanometers. However, the chromogenic reagent also takes measurement at 650
119
00:10:25.086 --> 00:10:30.007
nanometers, and this signal is subtracted from the signal taken at the same time
120
00:10:30.066 --> 00:10:35.916
from 405 nanometers. This is to ensure that all of the noise from the general
121
00:10:35.976 --> 00:10:41.766
turbidity is subtracted and only the chromogenic portion
122
00:10:41.856 --> 00:10:44.646
of that signal is measured at that wavelength.
123
00:10:45.906 --> 00:10:51.126
We also recommend if your reader has a carriage speed setting, that that be set to
124
00:10:51.216 --> 00:10:55.956
slow. The measurement interval is 40 seconds for each of the reads.
125
00:10:56.016 --> 00:11:01.716
And then for the standard curve measurement criteria, that log-log linear reduction
126
00:11:01.731 --> 00:11:06.216
that I mentioned. So our package inserts outline these points.
127
00:11:06.277 --> 00:11:12.216
If you follow these points with a valid microplate reader, then we guarantee the
128
00:11:12.246 --> 00:11:13.926
results of the reagent.
129
00:11:15.936 --> 00:11:20.796
Now, what we have done is we've partnered with molecular devices to create a
130
00:11:20.856 --> 00:11:26.106
protocol for you that fits these criteria. So no need to set that up.
131
00:11:26.166 --> 00:11:29.286
It's automatically set up for you in the protocols.
132
00:11:29.616 --> 00:11:35.196
So what I want to do is look at some example data of a comparison of an
133
00:11:35.286 --> 00:11:40.716
assay run on two different readers, the molecular device reader, and a reader that
134
00:11:40.777 --> 00:11:45.996
we would use in-house that we currently use for the validation of the reagent to
135
00:11:46.086 --> 00:11:51.906
see the differences in the data, and the similarities, and also the
136
00:11:51.996 --> 00:11:56.527
validity of the report as it is generated.
137
00:12:00.096 --> 00:12:05.706
So first, I have data using our PyroStar® ESF reagent, which
138
00:12:05.856 --> 00:12:09.906
is that kinetic turbidimetric reagent.
139
00:12:10.326 --> 00:12:16.266
We ran the standard curve along the full range that we have validated the reagent
140
00:12:16.386 --> 00:12:21.007
at from 10 all the way down to 0.01 endotoxin units per milliliter.
141
00:12:21.996 --> 00:12:27.246
We've set up the reagent with the parameters that we would have
142
00:12:27.606 --> 00:12:33.126
specified in the protocols, and you can see the activation times and the linear
143
00:12:33.246 --> 00:12:37.596
regression equation that both readers would have produced.
144
00:12:38.406 --> 00:12:42.096
Now, we'll get to the measure of validity in a moment
145
00:12:43.716 --> 00:12:49.296
in the specifications that USP 85 requires of a valid standard curve.
146
00:12:49.356 --> 00:12:54.907
But I do want you to notice at the offset here, we are getting slightly different
147
00:12:55.056 --> 00:13:00.996
values for activation time. Now, you'll notice I haven't mentioned any specific
148
00:13:01.026 --> 00:13:06.231
requirement for activation time, and I'll explain the reason that's the case is
149
00:13:06.246 --> 00:13:11.526
because there are so many variables that can affect activation time, but are
150
00:13:11.616 --> 00:13:15.727
accounted for by the production of a standard curve.
151
00:13:15.757 --> 00:13:21.366
But we'll take note and I'll provide an explanation of why these differences are
152
00:13:21.426 --> 00:13:25.806
reflected, and you can see that slightly in the standard curve.
153
00:13:26.227 --> 00:13:30.996
So they're very similar values, but there is a slight lengthening of the numbers
154
00:13:31.056 --> 00:13:35.916
for the SpectraMax® ABS Plus microplate reader than this reader that
155
00:13:37.536 --> 00:13:41.886
we use in-house for the validation of the reagent.
156
00:13:43.776 --> 00:13:48.936
When we look at the data that was produced, we'll start to understand the slight
157
00:13:48.996 --> 00:13:54.126
difference in activation times. First of all, I want to mention the fact that the
158
00:13:54.186 --> 00:13:58.806
linear regressions for the two are very, very good, nearly identical.
159
00:13:58.926 --> 00:14:04.477
So we have a nearly identical correlation, and of course, over time, the averages,
160
00:14:04.566 --> 00:14:06.875
we'd see no difference between these.
161
00:14:08.316 --> 00:14:14.227
But one thing I do notice, and it may be hard to see on the screen, is that the
162
00:14:16.116 --> 00:14:21.666
SpectraMax® ABS Plus reader is showing a different value
163
00:14:21.727 --> 00:14:27.426
for the optical density of the final reaction that takes
164
00:14:27.456 --> 00:14:33.186
place. That's perfectly fine. Once again, we have no specified values for that.
165
00:14:33.216 --> 00:14:38.586
But what that does mean is that that measure of optical density is relative.
166
00:14:38.646 --> 00:14:40.926
It is unique to each of the readers.
167
00:14:40.956 --> 00:14:46.866
And so that reason right there with that threshold value of 0.015 is the reason we
168
00:14:46.926 --> 00:14:50.166
got slightly different activation times.
169
00:14:50.227 --> 00:14:55.596
However, we can, in a sense, cross-reference calculated values into the standard
170
00:14:55.626 --> 00:15:00.426
curve to eliminate some of these variables that would have come about by the
171
00:15:00.576 --> 00:15:03.157
optical density. And I show that right here.
172
00:15:04.146 --> 00:15:09.996
So basically what I have in the first graph is a measure of the true values
173
00:15:10.086 --> 00:15:15.276
in the terms of the control standard endotoxin concentrations that were used, and
174
00:15:15.336 --> 00:15:20.466
the values that were produced by the in-house reader and the SpectraMax® ABS Plus
175
00:15:20.586 --> 00:15:26.361
reader. So in a sense, basically, the raw activation times
176
00:15:26.407 --> 00:15:31.176
were used to create the standard curve, and then we plugged those activation times
177
00:15:31.296 --> 00:15:33.831
back into that standard curve that was produced.
178
00:15:34.535 --> 00:15:40.447
Now, it's just a fact of linear regression that the line of best fit is, in a
179
00:15:40.477 --> 00:15:45.996
sense, going to compromise through those data points to find that line of best
180
00:15:46.056 --> 00:15:51.486
fit. And so typically, the extreme ends will be, in a sense, biased in one
181
00:15:51.546 --> 00:15:56.046
direction, while the median points will be biased in another direction.
182
00:15:56.061 --> 00:16:01.356
And you see that here, where in the bottom graph, we're seeing difference from true
183
00:16:01.386 --> 00:16:05.796
value for the in-house reader and the SpectraMax® ABS Plus.
184
00:16:05.826 --> 00:16:09.876
We're seeing, in a sense, an under-reporting at the extremes and then an
185
00:16:09.966 --> 00:16:15.876
over-reporting at the means. That's just the fact that we have a linear regression
186
00:16:16.836 --> 00:16:20.046
calculation taking place here in that line.
187
00:16:20.106 --> 00:16:25.536
The data has a slight curve to it, and that line is approximating
188
00:16:26.197 --> 00:16:31.026
the regression for that. This is perfectly normal.
189
00:16:31.326 --> 00:16:36.276
Once again, we're seeing values well within the 50% to 200% range.
190
00:16:37.206 --> 00:16:42.846
That is the overall accuracy, or I should say, resolution of the
191
00:16:42.936 --> 00:16:48.157
assay. But what I want to focus on is what we're seeing here is difference from
192
00:16:48.186 --> 00:16:50.346
true value for these two different readers.
193
00:16:50.736 --> 00:16:56.197
Then a comparison of the difference between measurements, and in a sense, we take
194
00:16:56.227 --> 00:17:01.551
the values from the SpectraMax® ABS Plus reader and make a direct
195
00:17:01.596 --> 00:17:06.216
comparison to those endotoxin values from that in-house reader that we would use.
196
00:17:06.876 --> 00:17:11.181
You can see virtually no difference between those.
197
00:17:11.197 --> 00:17:15.757
Of course, there's variability as we will have in a physical world, but what we're
198
00:17:15.786 --> 00:17:19.236
seeing is basically exactly the same values.
199
00:17:19.716 --> 00:17:25.536
So what that's telling us is the readers are even picking up on the nuances of the
200
00:17:25.566 --> 00:17:30.937
endotoxin assay itself and are providing for us virtually identical results.
201
00:17:32.466 --> 00:17:37.866
The important thing, however, is that all test criteria are met for these
202
00:17:37.926 --> 00:17:42.876
results, and the difference between readers falls within that measurement error.
203
00:17:43.356 --> 00:17:48.426
Of course, the specified error of 50% to 200%, and then also the linear regression
204
00:17:48.546 --> 00:17:52.116
error that we were seeing for this specific standard curve.
205
00:17:54.756 --> 00:18:00.697
We also did a very similar comparison with the same readers, just with
206
00:18:00.756 --> 00:18:05.496
that chromogenic assay, and you can see here the standard curve range now
207
00:18:05.616 --> 00:18:10.956
encompasses the entire standard curve that we had, and you can see the activation
208
00:18:11.046 --> 00:18:16.086
times. Once again, we're seeing for the SpectraMax® ABS Plus reader a slight
209
00:18:16.206 --> 00:18:20.016
lengthening of those activation times.
210
00:18:20.706 --> 00:18:25.836
You can see the linear regression of the standard curve here that we see
211
00:18:27.697 --> 00:18:33.246
Here you can see the graphs of the time course and the activation that
212
00:18:33.276 --> 00:18:37.581
occurred. And you'll notice once again, we're seeing that difference in optical
213
00:18:37.716 --> 00:18:43.206
density, which is translating for us to that slight difference in activation times.
214
00:18:43.447 --> 00:18:49.296
Once again, no necessarily specified requirements for this, just something to
215
00:18:49.356 --> 00:18:53.796
observe and take note of. That's what we're seeing here because the readers are
216
00:18:53.826 --> 00:18:59.286
going to have different optical features, different ways of measurement.
217
00:18:59.466 --> 00:19:04.836
Optical density is a relative value that can vary based on the
218
00:19:04.896 --> 00:19:08.376
optics of the physical instruments themselves.
219
00:19:09.366 --> 00:19:14.435
But once again, when we plug in those true values, and
220
00:19:15.336 --> 00:19:19.056
we plug in the activation times against the standard curve to get the measured
221
00:19:19.086 --> 00:19:24.996
values, you can see here those differences that are produced, and you can see
222
00:19:25.056 --> 00:19:27.306
that linear regression error.
223
00:19:28.866 --> 00:19:33.697
The chromogenic reagent performs, in a sense, much better even than the
224
00:19:33.726 --> 00:19:39.606
turbidimetric reagent did. But even the difference between measurements lie within
225
00:19:39.666 --> 00:19:43.416
those as well. So once again, we see that
226
00:19:45.066 --> 00:19:48.426
the conclusion here is that all test criteria are met.
227
00:19:48.486 --> 00:19:53.706
We saw that linear regression, the correlation coefficient, absolute value above
228
00:19:53.916 --> 00:19:59.616
0.980, and then all measured values within that resolution of the test.
229
00:20:00.126 --> 00:20:05.437
And then even additionally, we see that the differences between the readers
230
00:20:06.426 --> 00:20:11.886
are within the error of the linear regression line itself when we plug the values
231
00:20:11.947 --> 00:20:13.146
back into each other.
232
00:20:14.676 --> 00:20:20.466
So in conclusion here, the Fujifilm Wako endotoxin test reagents and Molecular
233
00:20:20.526 --> 00:20:26.466
Device SpectraMax microplate readers with SoftMax Pro software provide a fully
234
00:20:26.586 --> 00:20:30.906
validated solution for your endotoxin testing needs.
235
00:20:31.956 --> 00:20:36.651
I want to say thank you for your time and allowing me to bring this presentation.
236
00:20:36.666 --> 00:20:42.246
I'm now going to turn the rest of the presentation over to Molecular Devices, and
237
00:20:42.276 --> 00:20:48.187
they're going to explain the details of the software protocol itself, especially
238
00:20:48.246 --> 00:20:49.986
focusing on the
239
00:20:51.187 --> 00:20:51.697
data
240
00:20:53.616 --> 00:20:58.356
compatibility in terms of data compliance with CFR and FDA
241
00:20:59.346 --> 00:21:03.096
GMP guidelines for that. Thank you so much for your
242
00:21:03.156 --> 00:21:05.886
time.
243
00:21:07.956 --> 00:21:11.676
I'm a senior application scientist at Molecular Devices.
244
00:21:11.736 --> 00:21:15.576
In my role with the company, I've worked to validate key assays on our microplate
245
00:21:15.606 --> 00:21:19.776
readers to meet the needs of scientists who are doing bacterial endotoxin testing
246
00:21:20.256 --> 00:21:24.621
and who need not only a plate reader that can generate the necessary data, but also
247
00:21:24.621 --> 00:21:28.236
analysis protocols that allow them to be compliant with regulations.
248
00:21:28.896 --> 00:21:32.496
I'm really happy to discuss with you today our collaboration with Fujifilm Wako
249
00:21:32.586 --> 00:21:36.306
Chemicals to provide solutions for endotoxin testing.
250
00:21:36.456 --> 00:21:37.866
Facts about our microplate readers.
251
00:21:38.346 --> 00:21:41.406
Molecular Devices has been building them for nearly 40 years.
252
00:21:41.825 --> 00:21:45.891
The picture on the top is the Emax, one of the OG plate readers.
253
00:21:45.937 --> 00:21:49.896
In the middle pic, you'll see a SpectraMax reader enjoying some lovely weather in
254
00:21:49.926 --> 00:21:54.606
Antarctica. And the bottom photo is the International Space Station, home to two of
255
00:21:54.621 --> 00:21:59.286
our SpectraMax M5 readers. So almost anywhere you go, you will find Molecular
256
00:21:59.346 --> 00:22:04.146
Devices plate readers. The earth where the reader I want to focus on is the
257
00:22:04.206 --> 00:22:09.350
SpectraMax ABS Plus. This single mode absorbance reader has some features that make
258
00:22:09.396 --> 00:22:11.676
it ideal for bacterial endotoxin testing.
259
00:22:12.471 --> 00:22:15.876
Monochromator-based wavelength selection means that you don't have to install
260
00:22:15.906 --> 00:22:20.226
different filters for each assay because you have wavelengths all the way from 190
261
00:22:20.286 --> 00:22:23.706
nanometer to 1,000 nanometer all included on board the reader.
262
00:22:24.516 --> 00:22:29.796
Temperature can be regulated from five degrees Celsius above ambient to 45 degrees.
263
00:22:30.306 --> 00:22:34.671
Of course, this range does take care of the endotoxin assays which are run at 37
264
00:22:34.671 --> 00:22:39.306
degrees. Kinetic reads are easy to set up, and as I'll show you, we have preset
265
00:22:39.336 --> 00:22:43.566
protocols that automate the analysis for Fujifilm's endotoxin assays.
266
00:22:44.256 --> 00:22:49.116
The ABS Plus also has eight channel optics, so eight wells are read simultaneously.
267
00:22:49.596 --> 00:22:53.796
This means that a 96 well microplate can be read in just about five seconds.
268
00:22:54.697 --> 00:22:58.386
And all of the SpectraMax readers come with SoftMax Pro software.
269
00:22:58.956 --> 00:23:03.065
As I mentioned, we provide pre-configured protocols that you can use with the
270
00:23:03.096 --> 00:23:06.020
software to analyze assay data automatically.
271
00:23:06.711 --> 00:23:11.046
The endotoxin protocols themselves, I would like to talk a little bit about SoftMax
272
00:23:11.076 --> 00:23:15.606
Pro software, which is our microplate reader control and data analysis software.
273
00:23:16.326 --> 00:23:20.301
Its protocol library has pre-configured protocols for all sorts of microplate
274
00:23:20.346 --> 00:23:26.316
reader assays, over 150 protocols in all, including for endotoxin testing, DNA
275
00:23:26.406 --> 00:23:30.216
quantitation, ELISA analysis, cell viability, et cetera.
276
00:23:30.666 --> 00:23:33.246
And they're all set up to simplify the data analysis.
277
00:23:34.026 --> 00:23:39.036
Compliance tools are available for regulated, which is GLP/GMP laboratories, and
278
00:23:39.096 --> 00:23:43.176
we've designed endotoxin protocols that can be used in either regulated or
279
00:23:43.206 --> 00:23:48.156
non-regulated spaces. This Molecular Devices software that provides compliance
280
00:23:48.216 --> 00:23:53.166
features for GLP and GMP practices, including several features that are really
281
00:23:53.197 --> 00:23:57.081
important for labs engaged in bacterial endotoxin testing.
282
00:23:57.126 --> 00:24:02.796
With this software, you can achieve full FDA 21 CFR Part 11 and Annex 11
283
00:24:02.826 --> 00:24:07.866
compliance. So for details on how, rather than discussing them here, I'll go ahead
284
00:24:07.896 --> 00:24:11.256
and refer you to a Lab Notes article that's on our website.
285
00:24:11.316 --> 00:24:15.697
And this lays out very clearly what Part 11 and Annex 11 are, what the
286
00:24:15.726 --> 00:24:20.616
responsibilities of regulated customers are, the impact of compliance versus
287
00:24:20.676 --> 00:24:24.816
non-compliance, and plenty of other useful information if you're interested.
288
00:24:25.356 --> 00:24:30.426
So some of the ways that SoftMax Pro GXC software supports compliance are with
289
00:24:30.456 --> 00:24:35.197
things like electronic records and electronic signatures that provide audit trails
290
00:24:35.226 --> 00:24:39.937
that can be accessed for review. You can also get automatically generated reports
291
00:24:39.996 --> 00:24:42.876
to fulfill various compliance requirements.
292
00:24:42.891 --> 00:24:47.270
Some data are also saved to a secure database, and the database can be backed up
293
00:24:47.286 --> 00:24:52.776
and restored. If you'd like more information on how SoftMax Pro GXC software can
294
00:24:52.836 --> 00:24:55.805
help you keep your lab compliant, please visit our website.
295
00:24:56.136 --> 00:25:00.786
There's a wealth of information, articles, white papers, tutorials, videos, et
296
00:25:00.846 --> 00:25:06.366
cetera. Now, part of the endotoxin testing solution that we provided along with
297
00:25:06.396 --> 00:25:10.266
Fujifilm, which is our endotoxin test protocols.
298
00:25:10.356 --> 00:25:14.106
These are among our newest protocol offerings, and as such, we do make them
299
00:25:14.166 --> 00:25:18.576
available on SpectraNet, which is our customer care portal on Molecular Devices
300
00:25:18.591 --> 00:25:22.716
website. It includes our knowledge base, which is a great place to get detailed
301
00:25:22.746 --> 00:25:25.701
information, articles, answers to many of your questions.
302
00:25:26.226 --> 00:25:31.116
SpectraNet is also where you'll find the SoftMax Pro protocol homepage, where you
303
00:25:31.146 --> 00:25:34.986
can find the latest versions of protocols that may not have been implemented yet in
304
00:25:35.016 --> 00:25:38.796
the SoftMax Pro software, but that we want to make available to anyone who would
305
00:25:38.826 --> 00:25:42.846
find them useful. This is where you'll find the two endotoxin protocols that we've
306
00:25:42.906 --> 00:25:47.391
co-designed with Fujifilm to work seamlessly with their kinetic turbidimetric and
307
00:25:47.406 --> 00:25:49.806
kinetic chromogenic endotoxin assays.
308
00:25:49.836 --> 00:25:54.021
Analysis that can be done with a SpectraMax ABS Plus reader for a kinetic
309
00:25:54.067 --> 00:25:59.406
turbidimetric endotoxin assay. It's a two-hour kinetic read with absorbance reads
310
00:25:59.466 --> 00:26:04.356
taken at 405 nanometers every 40 seconds for the duration of the read.
311
00:26:04.386 --> 00:26:08.886
This adds up to about 181 data points, giving us plenty of resolution to make
312
00:26:08.976 --> 00:26:11.286
accurate calculations from the data.
313
00:26:11.346 --> 00:26:16.326
The calculation or the reduction that is done on this kinetic data includes setting
314
00:26:16.386 --> 00:26:21.486
the first OD or optical density value to zero and then calculating the amount of
315
00:26:21.546 --> 00:26:25.986
time that's required for the subsequent OD readings to reach a specified threshold
316
00:26:26.346 --> 00:26:32.136
or onset OD. So the higher the endotoxin concentration is, the more rapidly this
317
00:26:32.196 --> 00:26:37.026
onset OD will be reached. Once we've generated all the data, a standard curve is
318
00:26:37.086 --> 00:26:42.457
plotted as mean onset time versus control standard endotoxin or CSE
319
00:26:42.516 --> 00:26:46.730
concentration. The curve fit that we've chosen here and that Timothy mentioned
320
00:26:46.776 --> 00:26:51.516
before is the log log fit. This is one of the many curve fits that are available in
321
00:26:51.546 --> 00:26:55.957
SoftMax Pro software. And for the standard curve in this assay, the correlation
322
00:26:55.986 --> 00:27:01.266
coefficient for R value for the standard curve must be at least 0.98.
323
00:27:01.866 --> 00:27:06.246
In this example from SpectraMax ABS Plus, you can see that the requirement is met
324
00:27:06.276 --> 00:27:07.476
and in fact exceeded.
325
00:27:13.236 --> 00:27:16.866
I'm going to walk you through the kinetic turbidimetric assay protocol.
326
00:27:17.421 --> 00:27:22.116
This one has been designed specifically for the Pyrostarr ES F plate assay from
327
00:27:22.177 --> 00:27:26.646
Fujifilm Wako Chemicals. And the first thing you'll see is the introduction, which
328
00:27:26.736 --> 00:27:31.416
outlines how the protocol is to be used and also gives information on how the assay
329
00:27:31.476 --> 00:27:36.042
is set up It also describes how to set up the protocol's template so that the
330
00:27:36.102 --> 00:27:40.813
samples in the different wells of the microplate will be analyzed appropriately.
331
00:27:40.872 --> 00:27:45.057
Instructions on entering information in the Reagent Info and Product Summary
332
00:27:45.192 --> 00:27:48.013
sections, which I'll show you in a moment, are also given here.
333
00:27:48.792 --> 00:27:53.022
The protocol are the User Entry and the Signature section.
334
00:27:53.112 --> 00:27:58.332
The User Entry section has areas for entry of things like the technician who's
335
00:27:58.362 --> 00:28:02.052
performing the assay, the date the assay was performed, and then various
336
00:28:02.112 --> 00:28:06.612
information on the reagents used, including the lot number for each and the
337
00:28:06.672 --> 00:28:08.052
expiration date for each.
338
00:28:09.643 --> 00:28:14.143
Product information is also entered, and that would include information such as the
339
00:28:14.203 --> 00:28:18.703
manufacturer, the product code, product description, product lot number, and the
340
00:28:18.763 --> 00:28:24.013
expiration date. There's also an area where assay-specific values like the
341
00:28:24.042 --> 00:28:28.393
endotoxin limit that you need to set for your test, the lowest concentration on the
342
00:28:28.453 --> 00:28:32.592
standard curve, and also the product dilution are entered in this slide.
343
00:28:33.643 --> 00:28:38.247
Now, the Signature section serves as an important record of tester information and
344
00:28:38.322 --> 00:28:41.982
test date, as well as approval and the date that it was approved.
345
00:28:42.492 --> 00:28:46.092
Securing these details is very important to regulatory compliance.
346
00:28:47.082 --> 00:28:51.792
See the Product Summary section, where statistical linear regression parameters are
347
00:28:51.806 --> 00:28:53.516
pulled directly from the standard curve.
348
00:28:53.682 --> 00:28:58.438
That's once the assay is run, and calculations are automatically applied so that
349
00:28:58.482 --> 00:29:00.897
you can see right away whether your results pass or fail.
350
00:29:01.692 --> 00:29:05.382
Over on the right-hand side, you'll see an overall judgment on the assay.
351
00:29:05.442 --> 00:29:11.112
Again, this is pass or fail. In this case, the product endotoxin concentration,
352
00:29:11.143 --> 00:29:16.453
which is 2.445, has exceeded the sample endotoxin limit of 0.5
353
00:29:17.143 --> 00:29:20.412
EU per mil, so it's clearly indicated as a fail.
354
00:29:21.192 --> 00:29:25.302
On the other hand, the positive product control spike recovery was within the
355
00:29:25.362 --> 00:29:29.127
acceptable range for the assay, so it's indicated as a pass.
356
00:29:29.772 --> 00:29:34.377
Other assay criteria, such as the absolute value of the correlation coefficient,
357
00:29:34.842 --> 00:29:39.492
also passed, but all parts of the assay must pass for the overall result to be a
358
00:29:39.552 --> 00:29:44.787
pass. If sections where the data are actually displayed and analyzed, starting with
359
00:29:44.802 --> 00:29:47.412
the plate or the Test Plate section.
360
00:29:47.442 --> 00:29:50.203
Here, you'll see the instrument settings used to run the assay.
361
00:29:50.667 --> 00:29:54.732
And in this section, you can also use the template to assign specific wells to
362
00:29:54.822 --> 00:30:00.522
groups such as standards, negative control, or positive product control.
363
00:30:00.582 --> 00:30:04.797
Once the plate's read, you'll see in the plate view all of the raw kinetic traces,
364
00:30:04.842 --> 00:30:08.893
and you can get a general overview of how your assay worked.
365
00:30:08.953 --> 00:30:13.497
At the bottom, the reduction settings are summarized, and on the right-hand side is
366
00:30:13.542 --> 00:30:18.117
the read information. That's where the parameters like instrument information is
367
00:30:18.132 --> 00:30:22.572
displayed, along with the read date, the time, the temperature, things like that.
368
00:30:22.992 --> 00:30:26.802
If for some reason you're finding that your results don't look as expected or
369
00:30:26.982 --> 00:30:31.272
questions arise later on, having a record like this could be very useful to
370
00:30:31.302 --> 00:30:35.232
compliance. My favorite section is the Standard Curve.
371
00:30:35.802 --> 00:30:40.122
Data for the standards are plotted here as mean onset time versus the control
372
00:30:40.212 --> 00:30:45.042
standard endotoxin concentration with a log log curve fit automatically applied to
373
00:30:45.072 --> 00:30:49.542
the graph. So curve fit results are displayed here, and you'll see some of the
374
00:30:49.602 --> 00:30:53.502
parameters that are also summarized in the Product Summary section that we looked
375
00:30:53.533 --> 00:30:58.513
at previously. The R squared value is also displayed here, and it lets you know how
376
00:30:58.572 --> 00:31:02.081
good, objectively, your standard curve linearity really is.
377
00:31:02.832 --> 00:31:07.332
Section will list the onset time for each well, along with the mean and the
378
00:31:07.393 --> 00:31:09.432
standard deviation and the percent CV.
379
00:31:10.242 --> 00:31:14.922
For each set of standard replicates, pass indicates a percent CV that's less than
380
00:31:15.102 --> 00:31:20.817
20. Below the table, you'll see a summary of statistical regression parameters, and
381
00:31:20.862 --> 00:31:24.882
there's a calculation to determine whether the absolute value of the correlation
382
00:31:24.972 --> 00:31:27.222
coefficient test passes or fails.
383
00:31:27.882 --> 00:31:31.513
Sections I'm showing here are for the negative control, the sample, and the
384
00:31:31.602 --> 00:31:37.152
positive product control. The negative control should confirm the absence of
385
00:31:37.212 --> 00:31:42.582
detectable endotoxin in the assay system, and as you can see here, it does.
386
00:31:43.572 --> 00:31:48.882
In the sample section, you get to see whether endotoxin that's detected is under
387
00:31:48.942 --> 00:31:50.652
the limit that you've set for your assay.
388
00:31:50.922 --> 00:31:55.272
In this example, although the assay replicates are good, you can see the percent CV
389
00:31:55.332 --> 00:31:58.122
is less than 20 for each set of replicates.
390
00:31:58.182 --> 00:32:02.712
The sample endotoxin concentration has in fact exceeded the test limit, so the
391
00:32:02.802 --> 00:32:08.712
overall result is a fail here. The positive product control, or PPC, is
392
00:32:08.772 --> 00:32:12.866
a test that's performed to make sure that the product you're testing doesn't have
393
00:32:12.912 --> 00:32:16.842
interfering factors in it that are going to skew the results of your test.
394
00:32:17.862 --> 00:32:21.703
So in this test, what you do is spike the test sample with a known quantity of
395
00:32:21.763 --> 00:32:26.592
endotoxin. As Timothy mentioned, this is typically a concentration of endotoxin
396
00:32:26.607 --> 00:32:30.987
that's near the middle of the standard curves range, and then you confirm that this
397
00:32:31.063 --> 00:32:36.492
is accurately quantified. So the test criteria here is that the calculated spike
398
00:32:36.522 --> 00:32:42.102
recovery needs to be between 50% and 200% of the actual concentration.
399
00:32:42.132 --> 00:32:46.632
In this example, the result is somewhat close, but it does pass.
400
00:32:46.752 --> 00:32:50.982
I really hope that Timothy and I have shown you how Fujifilm Wako Chemicals'
401
00:32:51.042 --> 00:32:56.082
endotoxin test reagents, in concert with Molecular Devices' SpectraMax microplate
402
00:32:56.143 --> 00:33:00.672
readers and the SoftMax Pro software that powers them, are a fully validated
403
00:33:00.703 --> 00:33:03.147
solution for your bacterial endotoxin testing.
404
00:33:03.777 --> 00:33:06.536
And I want to thank you very much for your time and your attention.
Related products
Request Quote for All Products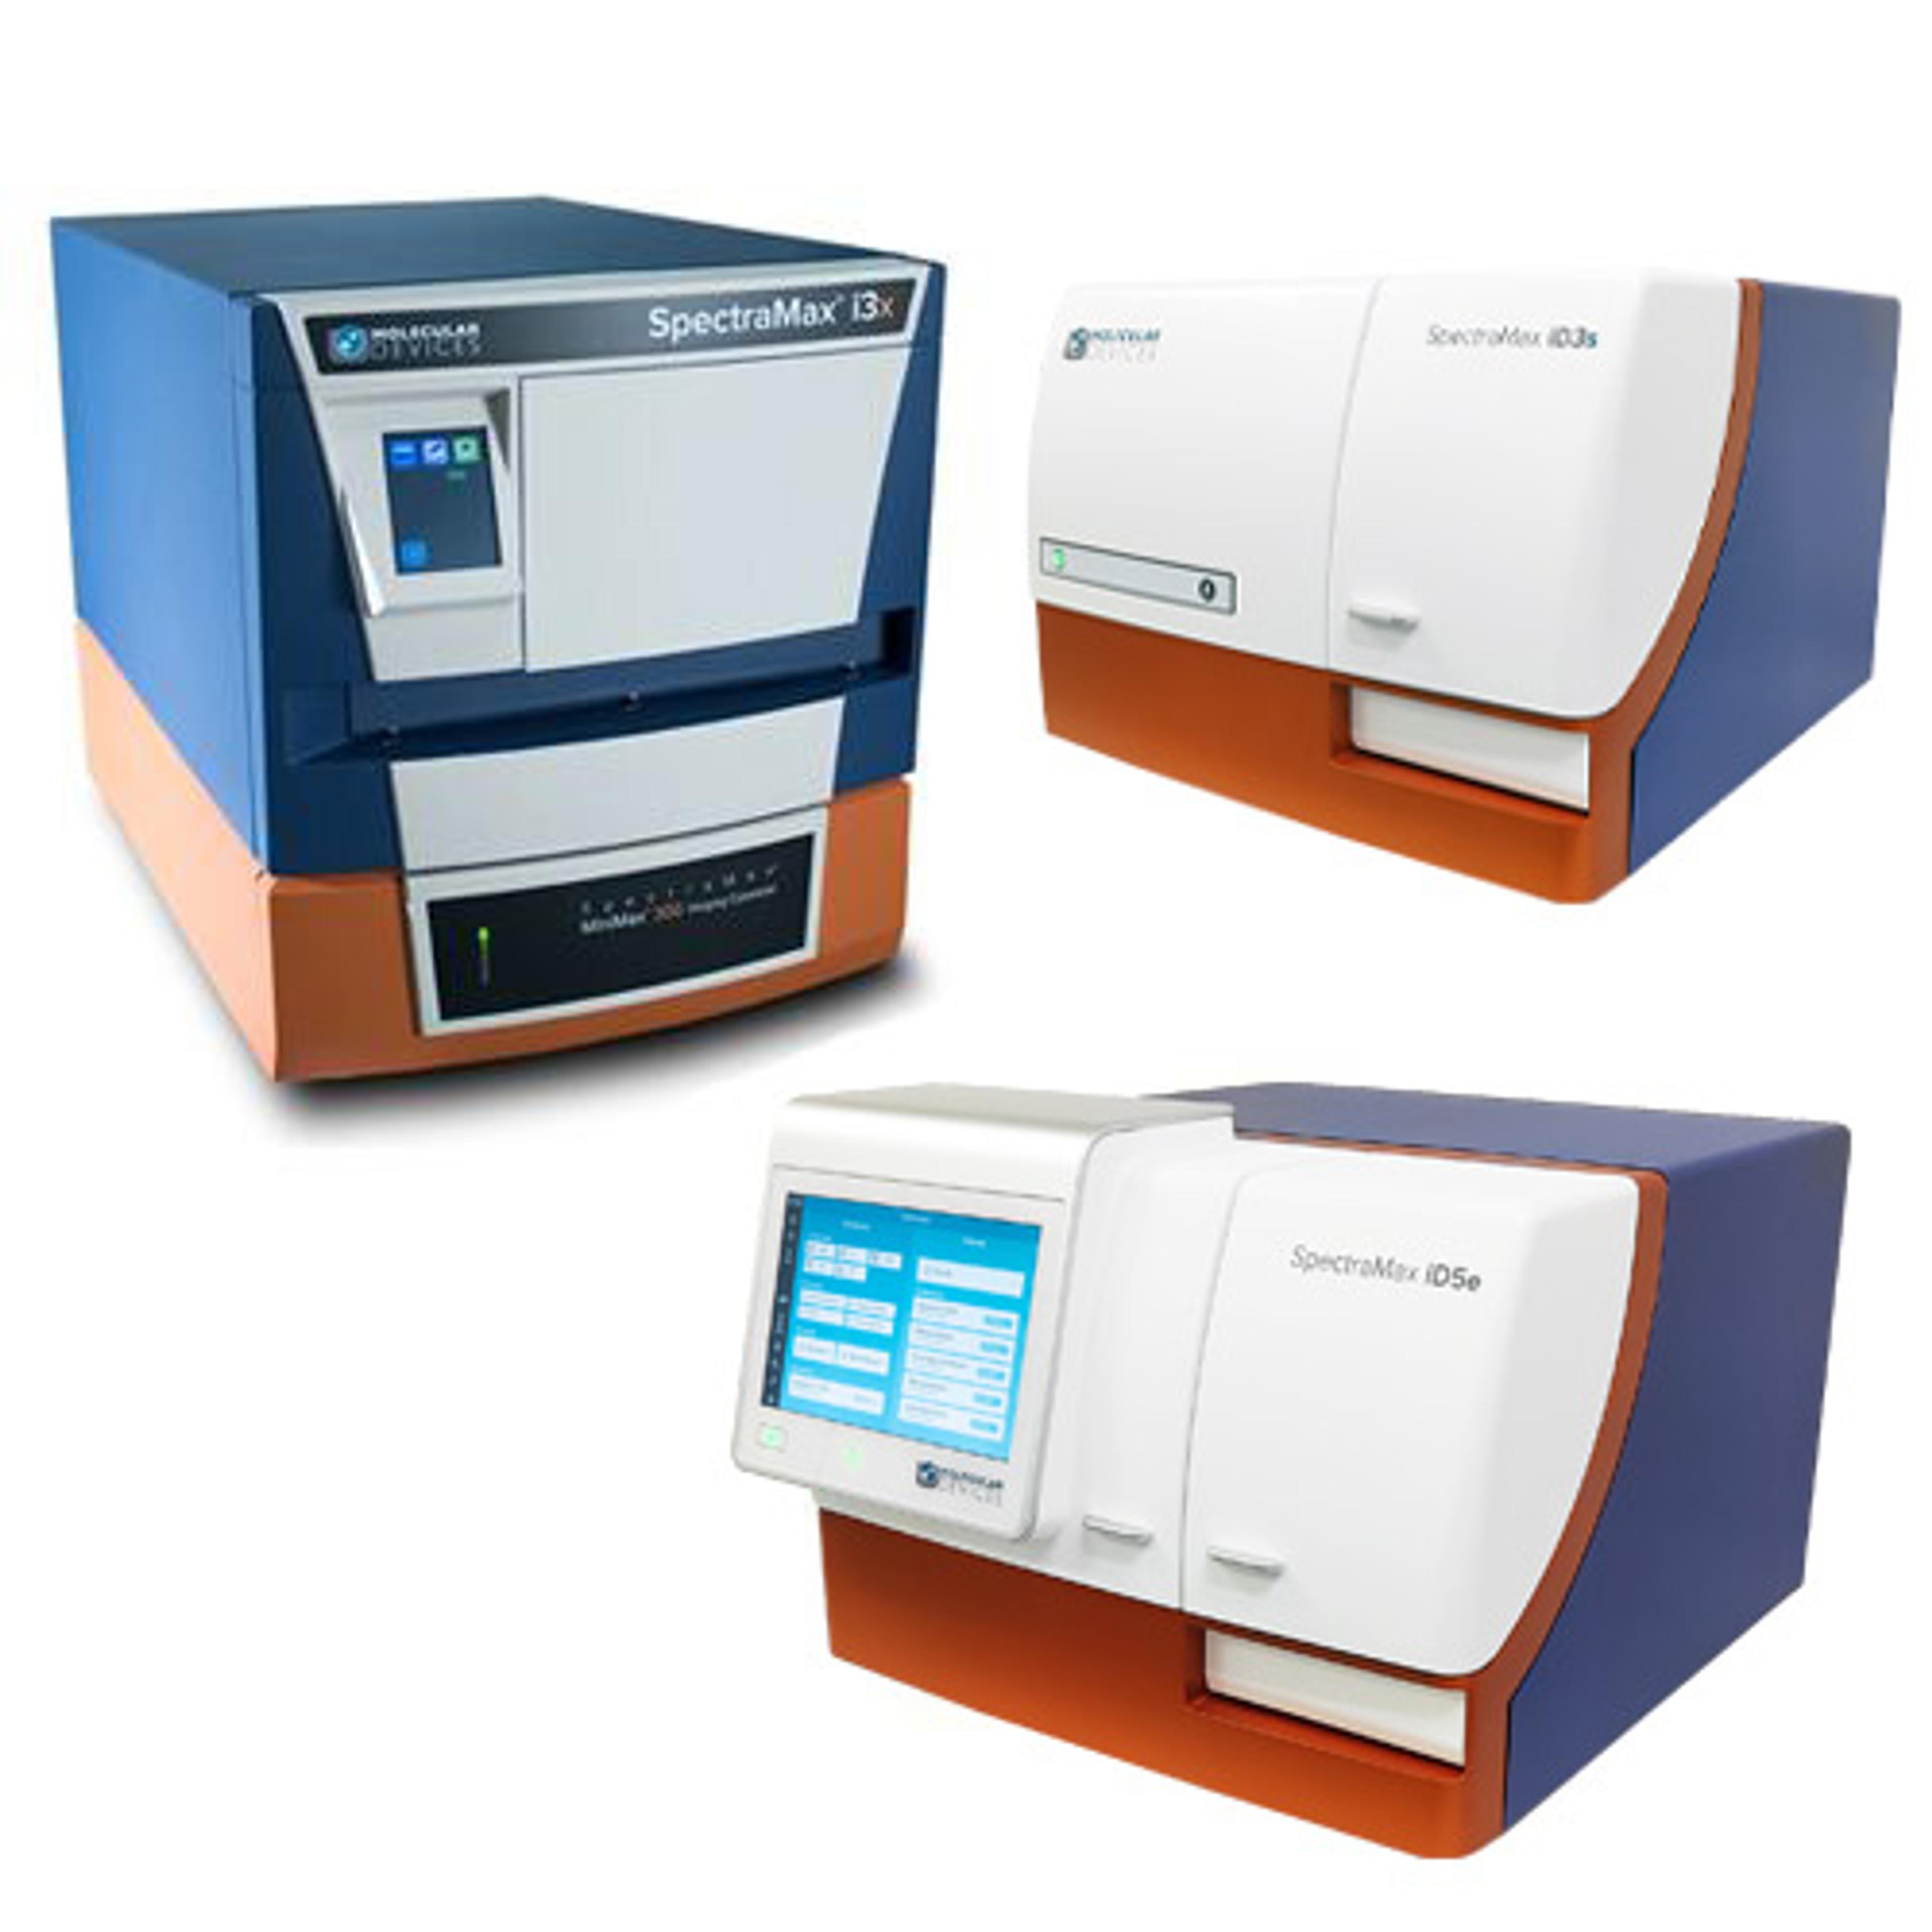
SpectraMax® Microplate Readers
Molecular Devices®The SpectraMax® line of user-friendly microplate readers provide great flexibility for labs conducting applications ranging from ELISAs to nucleic acid and protein quantitation, and include absorbance, fluorescence, luminescence and more
SoftMax® Pro Microplate Data Acquisition & Analysis Software
Molecular Devices®SoftMax ® Pro Software is designed to provide the simplicity, flexibility and power required for advanced data analysis. It provides ready-to-run protocols, analysis algorithms, and 21 different curve fit options. Every step has been optimized for data acquired from a Molecular Devices microplate reader or data imported from another source to simplify analysis and reporting. FDA 21 CFR Part 11 compliance tools are available for regulated laboratories providing end-to-end chain of custody.
SoftMax® Pro GxP Software
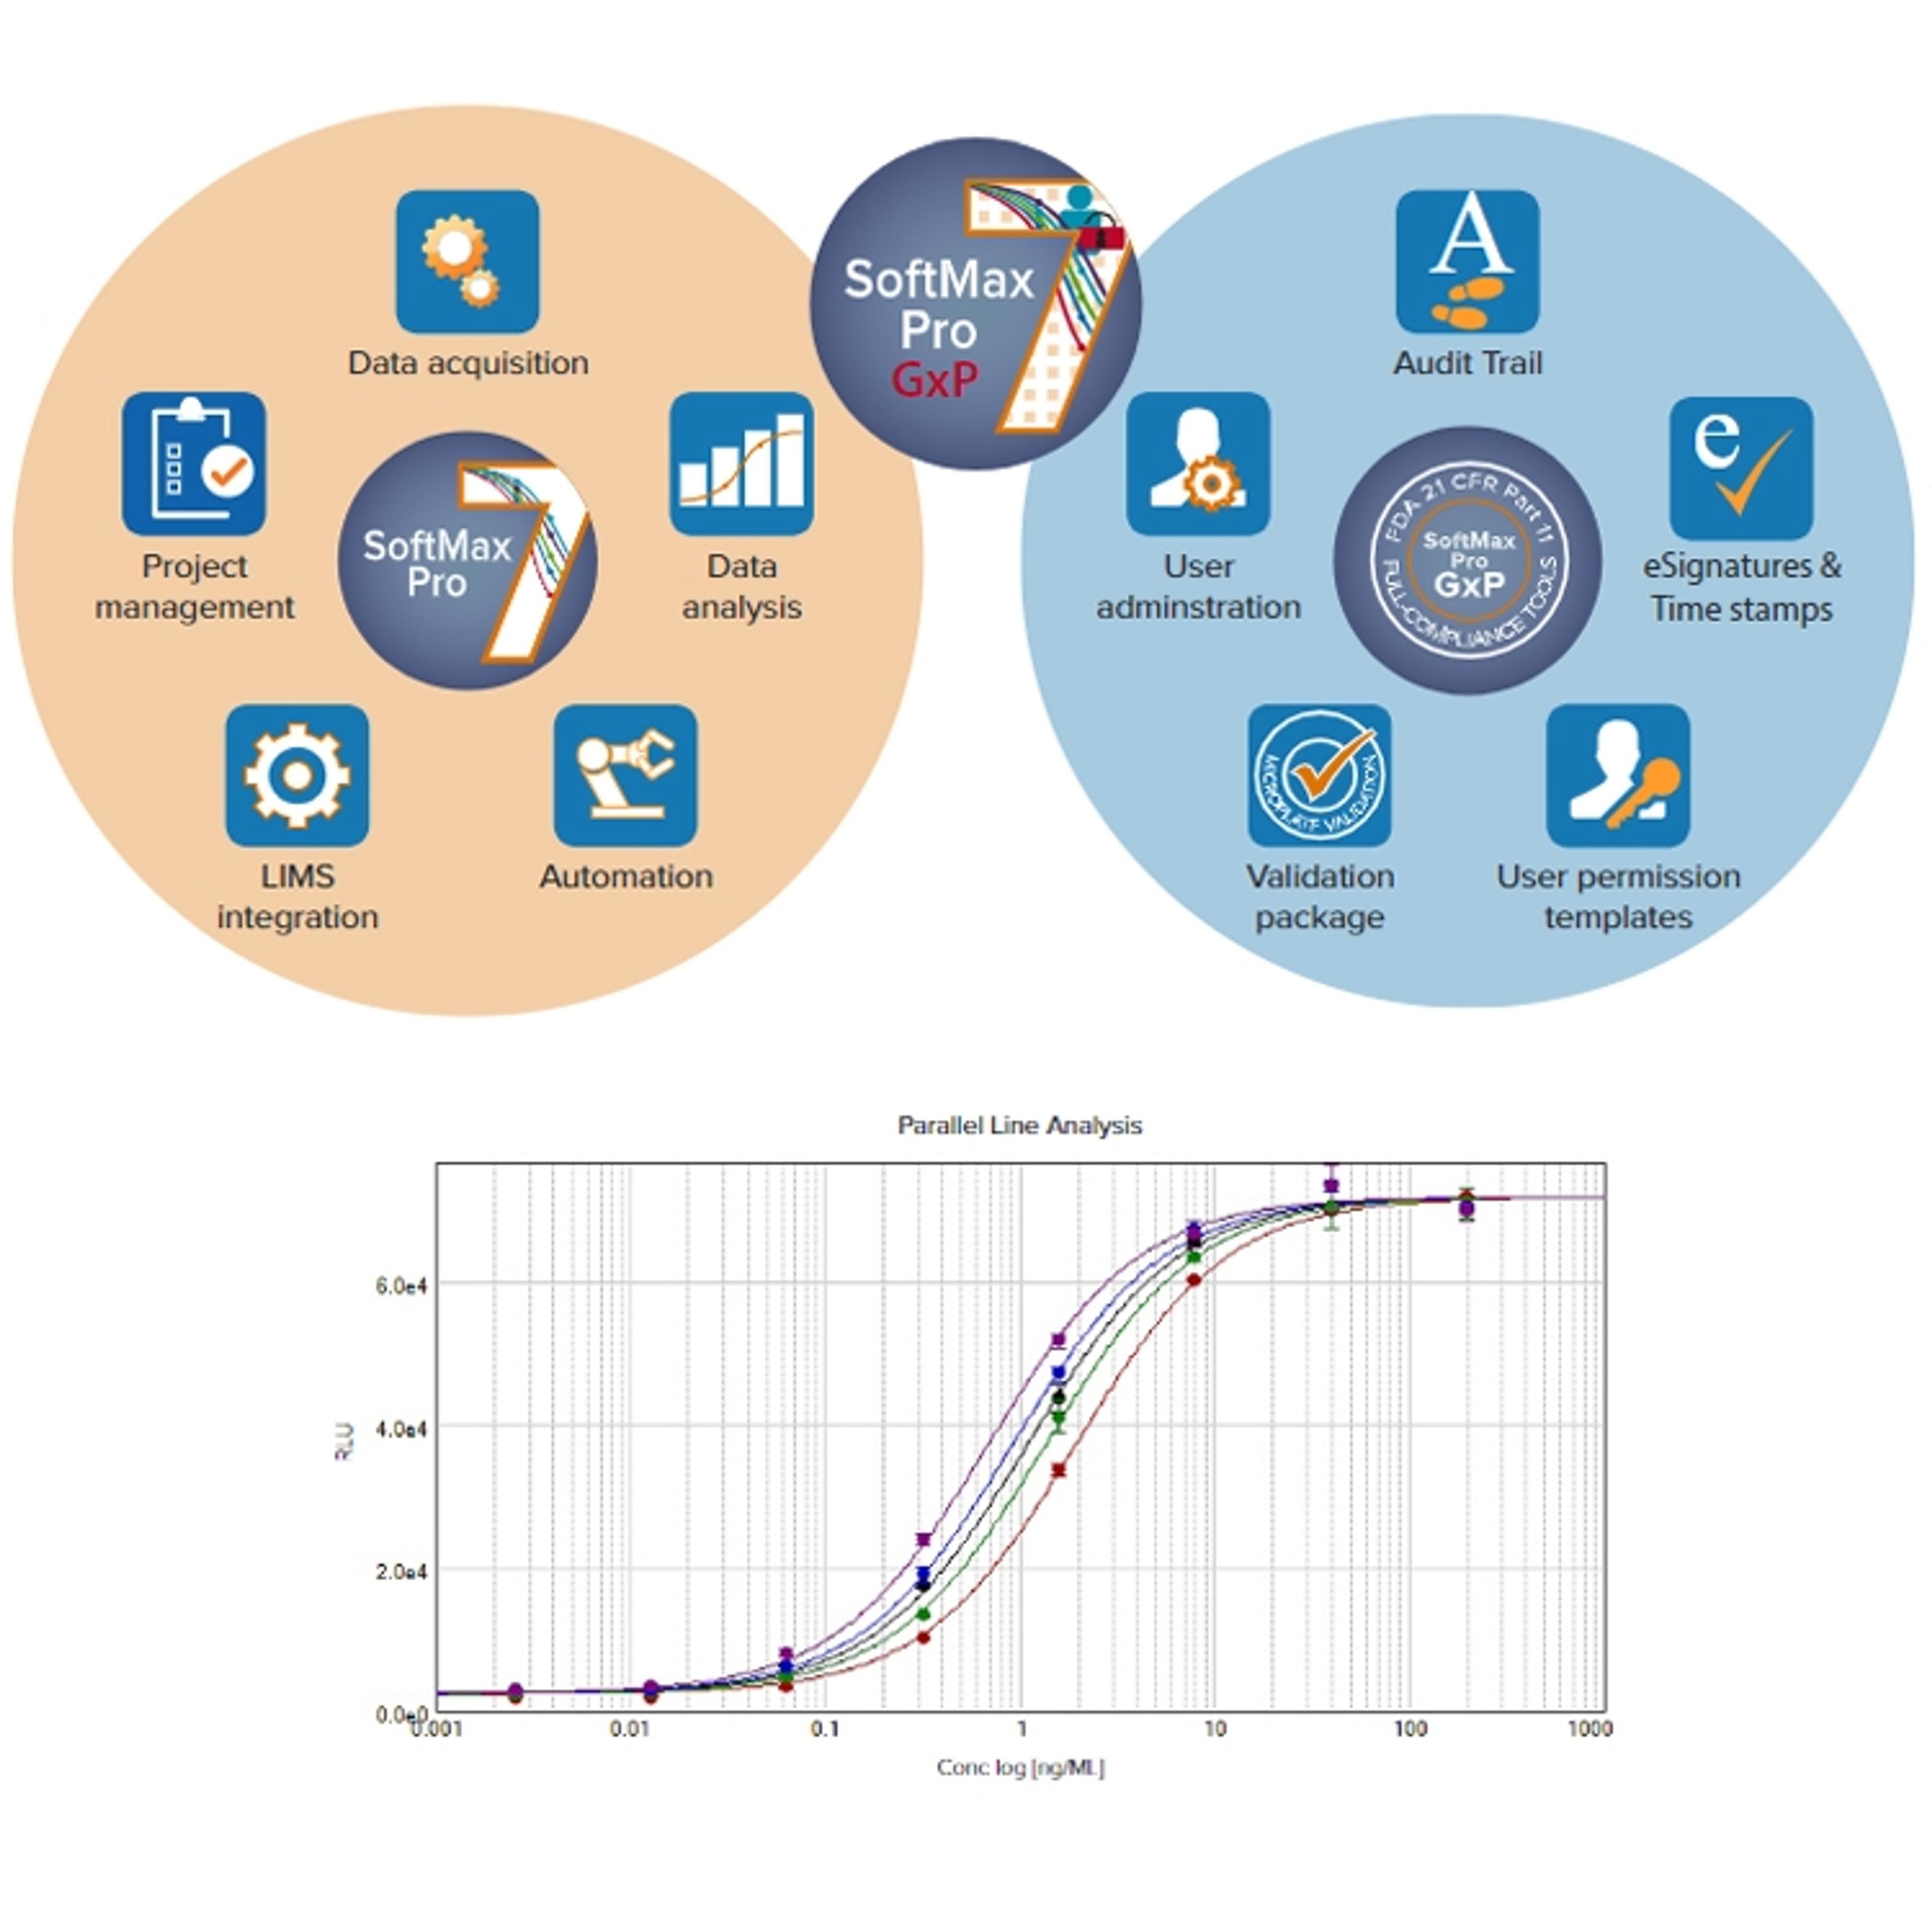
Molecular Devices®Meet FDA guidelines in GMP/GLP labs with complete validation tools