Gaining insights into complex biological phenotypes with advanced live cell high-content screening capabilities
18 Jun 2026
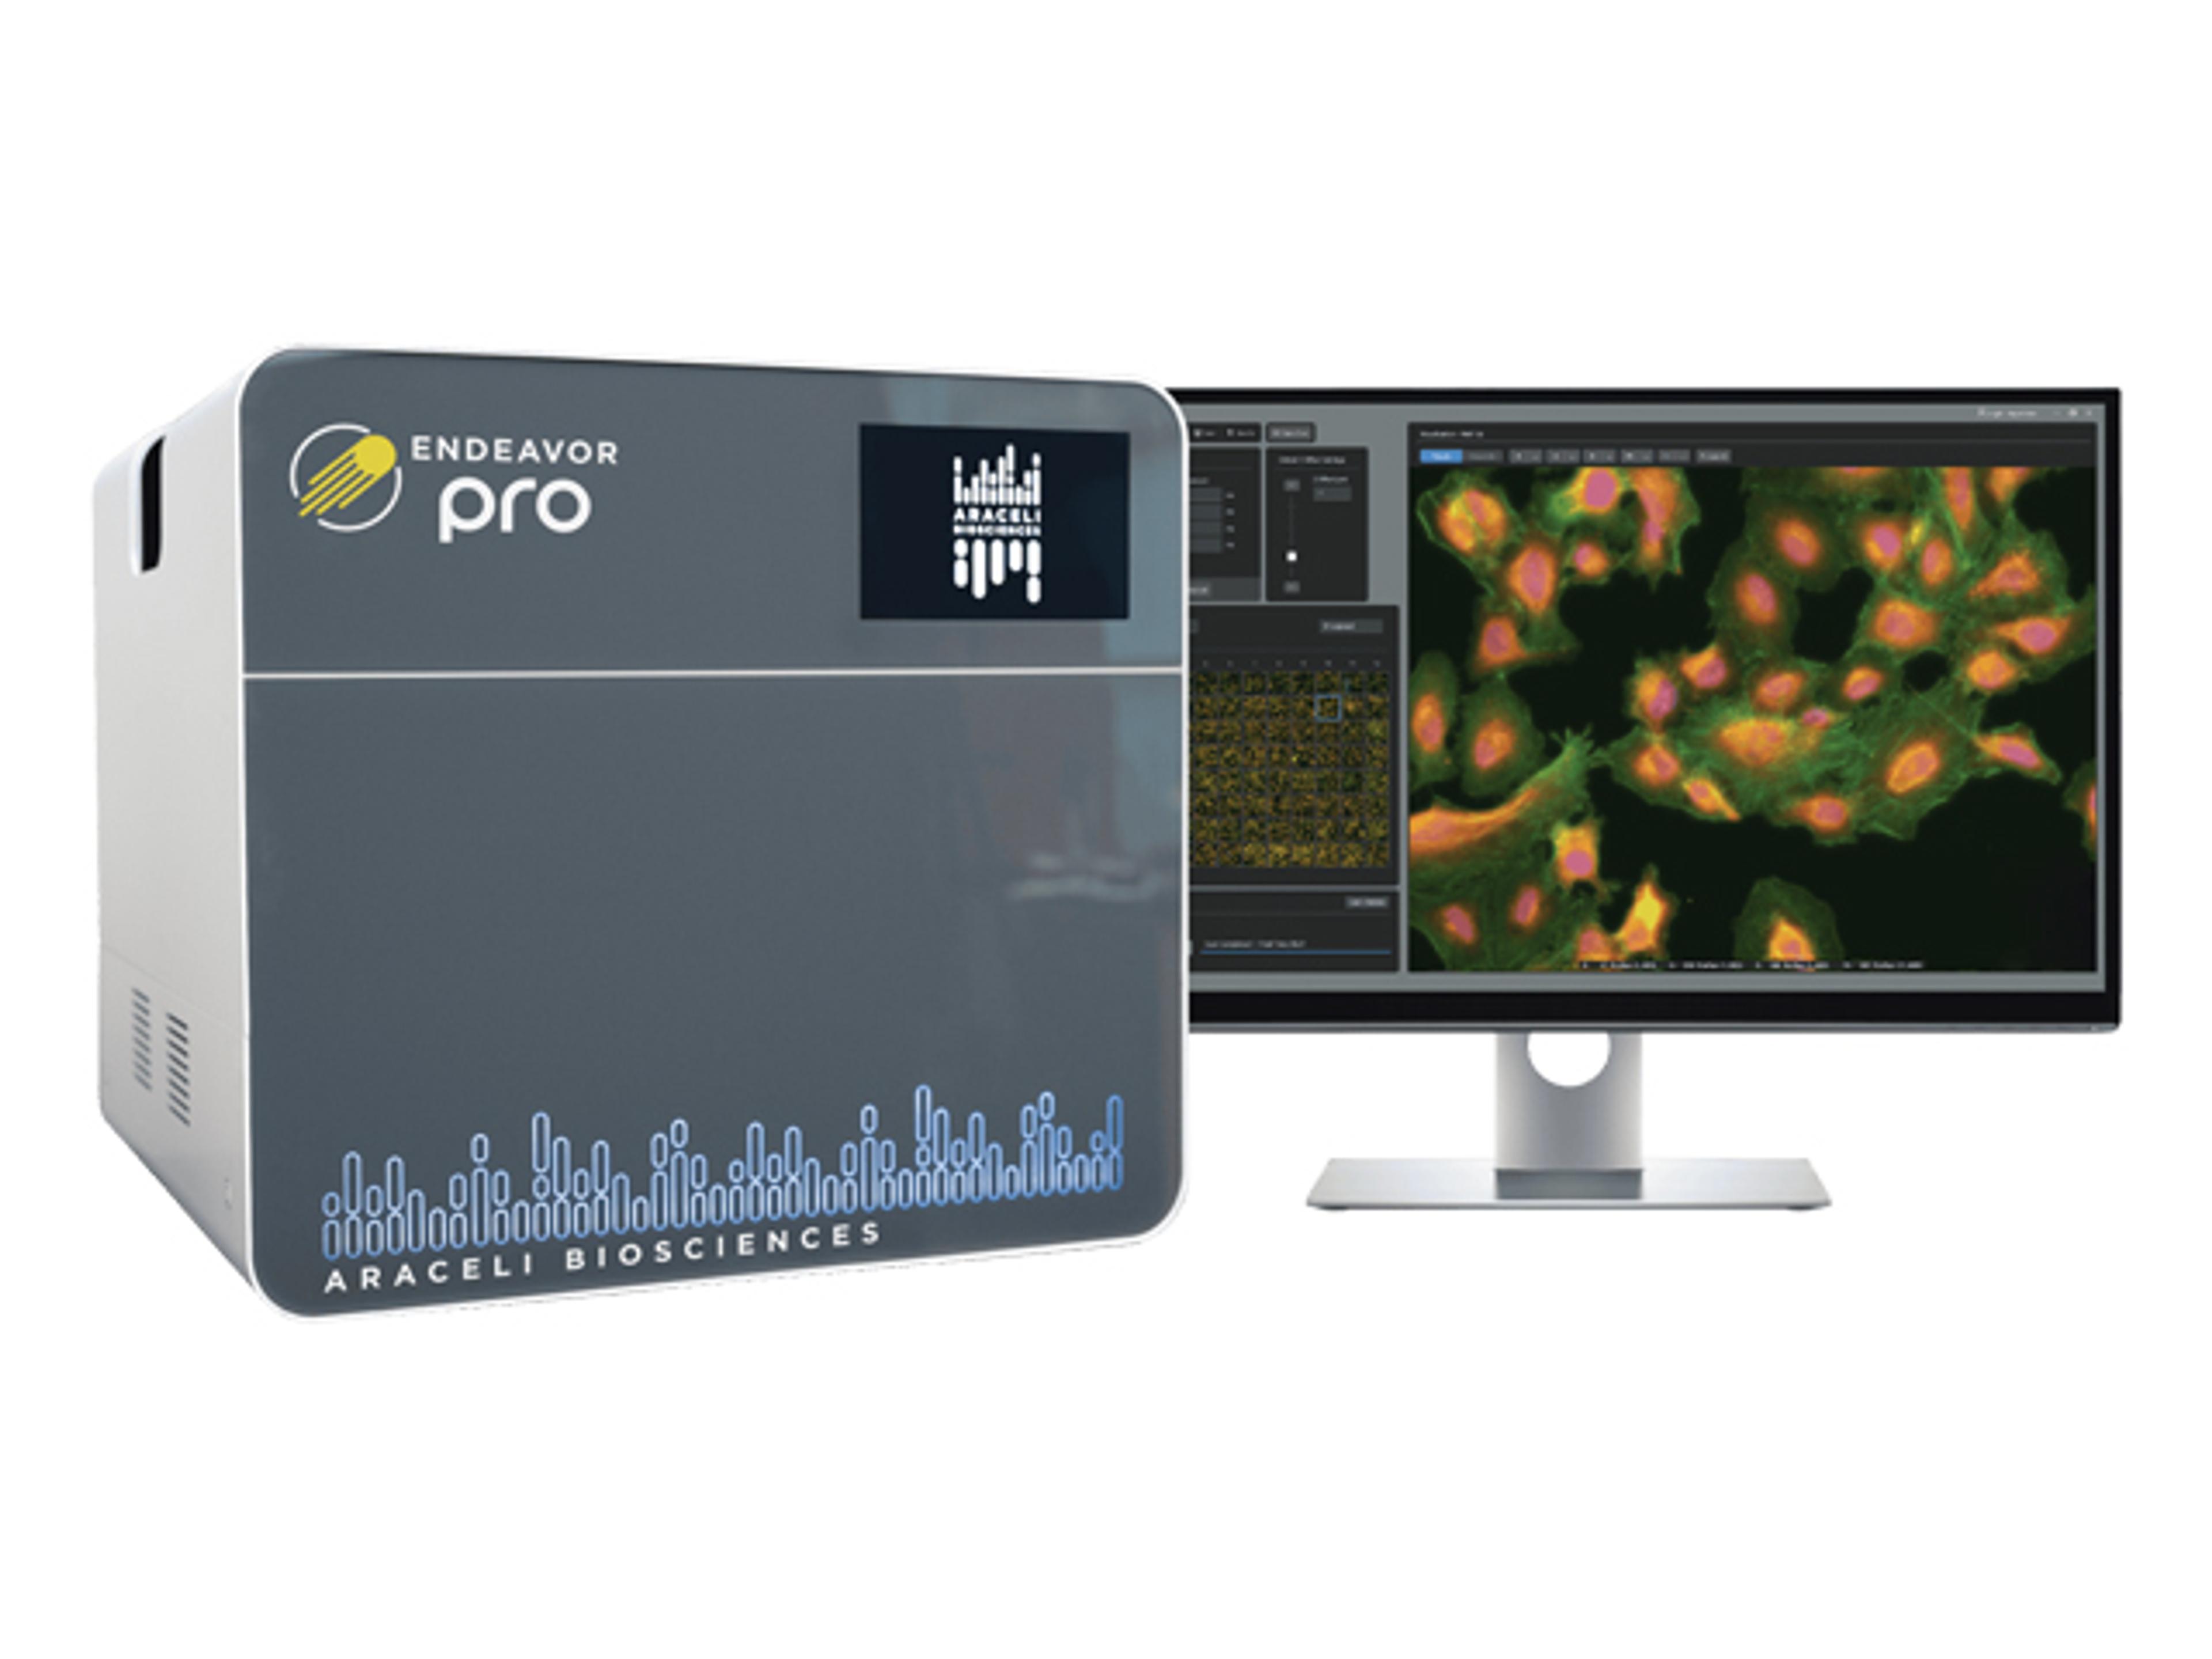
In this presentation, Dr. Patrick Shire, a research scientist in the Imaging and Analysis group at Evotec, describes how his team uses the Endeavor platform from Araceli Biosciences to transform imaging from a final readout into a real-time experimental tool. Shire outlines an end-to-end workflow spanning automated plate handling, live-cell acquisition, AI-driven segmentation, fingerprinting, and mechanism-of-action analysis. He demonstrates how rapid imaging of 384- and 1536-well plates enables continuous quality control, data-driven experimental decisions, and the capture of dynamic phenotypes such as cell-cycle effects and toxicity, generating deeper biological insight than traditional endpoint assays.
This presentation was filmed at SLAS Europe 2026.
About the company

Araceli Biosciences
Araceli Biosciences is on a mission to create cutting-edge technologies that empower researchers to accelerate therapeutic discovery. Speed is essential for furthering our understanding of biology and helps in finding better drug candidates with more confidence upstream in the drug discovery pipeline by acquiring high quality data that produce actionable answers. Our goal is to be the leader in predictive AI-based image acquisition and analysis, enabling more informed decisions to increase therapeutic success. We envision a future where patients have earlier access to the most effective treatments.
Video transcript
Show transcript
Hello everybody. Thank you for coming. My name is Patrick Shire. I’m a research scientist in the imaging and analysis group at Evotec. And today I’m going to be showing you some advances we have in our high throughput live cell capabilities and how we can use this to gain insights into complex biology, biological systems. So an agenda for today. I’m going to start by showing you our current… capabilities in high content screening at Ibotek, and also the integration of the RSLE Endeavor imaging platform, which enables us to perform live cell high content screening. And followed by that, I will take us through some of these new capabilities in live cell screening, some data analysis pipelines that are required that needed to be implemented to support this new process. And finally, some interesting insights that we are able to capture from live cell systems. So first off, high content screening at EvoTec. So at EvoTec, we have a dedicated imaging and analysis group that supports the process of high content screening from across the entire process from instrumentation. So we handle the acquisition of images using a wide variety of heterogeneous population of imaging devices. And these, yeah, we support that. for development of these processes for the acquisition in a screening format. So this varies from different formats from screening and profiling of assays down to other approaches such as histology and histology samples. And this requires the heterogeneous imaging device platforms to choose the best device for the current problem. As well as the instrumentation, we also handle the image analysis and designing of the best image analysis strategy for the current problem. And this involved in assay development through to extracting the best quality features from the images for downstream processing. We also handle data analysis. So how do we actually gain meaningful insights from the data that we extract from images? And additionally, this is all linked into the science so how can we successfully get scientific meaningfully data from the images and this is in close collaboration with a biological application experts to determine what is the best approach for the image analysis strategy and the downstream processing. At EvoTec, we have expertise in high content and high throughput screening. And we have 10 integrated high throughput screening platforms across multiple sites, mainly in Hamburg, Germany and Toulouse, France. And all of these platforms are fully automated and fully integrated to allow high throughput screening campaigns up to a miniaturization of including 1536. So we have machines for handling 1536 and miniaturize high throughput screening campaigns. We have a wide variety of endpoint assays that can be utilized, and this includes, not excluding, RT-QPCR, biophysical readouts such as SBR and NMR, and mass spectrometry-based readouts, and also looking at ion channels and transporters in flipper assays. These approaches are all supported by a centralized compound management solution system, which allows us to prepare the screening libraries for screens, as well as the centralized data statistics and discovery informatics. groups to help us to extract as much information from these screens as possible. Where the talk will focus on my area of expertise is in the high content screening and from this we have numerous automated microscripts for imaging-based systems so we can also perform imaging-based readouts as well. So what does this look like? So an automated high content screen at Evotec involves robotic handling of compound management initially and this is compound spotting of compounds into screening plates. And this is performed in an automated approach. So for an example, we have libraries of molecules that can be automated, spotted into high throughput screening plates, and then moved onto a robotic system to process in cell incubation, compound transfer, and also staining and fixation approaches. Following fixation, these can be moved on to imaging platforms for high throughput content screening, for example, with Opera Phoenix or the newly acquired Endeavor Pro. systems following this this then leads into the data analysis side so where do we how can we extract information from the images and perform hit calling and yeah so what are the new capabilities we have expanded our capabilities with the acquisition of of the integration of the Endeavor Pro ultra fast imaging device into our high throughput screening platform and this enables us to perform fast acquisition of plates in an integrated approach with the high throughput platform and this pushes us towards higher throughput in 1536 world screens specifically. So we have integrated Endeavor Pro into the high-res automation platform and this enables us to perform increased throughput in screening up to 100 plates in a 384 world plate format per day in a live system and up to 200 when we include after our acquisition throughout the entire day these platforms are fully automated and have liquid handling solutions included so handling of integration with the ability to add solutions so from staining overweight to fixation and imaging on the same platform so what are our new capabilities in live cell screening And first off, I’d like to show you our current workflow for high content screening. And this is designed around the ability to run the devices at their own speed in order to achieve cost efficiency. So currently, we separate the processes into two distinct separated processes. The first is the preparation stage, where plates are on the automated platform. We perform cell seeding, treatment with compounds, followed by incubation and staining, and this is performed on a high throughput screening platform, followed by manual transfer to an automated acquisition platform where we then acquire confocal high content automated acquisition of images. And the main reason for this is so we can… run the plates at their own speed. So acquisition, especially on 1536 ball plates, can take a long time with more complex assays. So when we have four fluorescent channels, this can take up to an hour and 40 minutes per plate. And if we were to run this in a fully automated on one platform, we would have a lot of downtime of the machines. So these processes are separated in order to run the machines at cost efficiency currently. With the integration of the ultra fast imaging we can essentially couple these processes together so that when plates are prepared on the high throughput screening platform and are stained then they can immediately be imaged and these two processes can be coupled together and this is enabled by the fast imaging on the endeavor pro system where we can acquire 1536 world plate in around six minutes, enabling these processes to be coupled. So after staining is completed, then we can immediately go to imaging, which increases our throughput. As well as endpoint assays with staining, and the majority of my talk will be focused on live cell screening, we can additionally use these fast imaging to acquire a snapshot across the entire screening process from after cell seeding, after treatment, and throughout the incubation period and this gives us an ability to assess the biological processes across the entire screen and not just at the end point with a traditional staining based approach. This additionally enables us to use this on the screening platform across a wide variety of screens with different end point assays as well so for example we can monitor with the Endeavor Pro. during live cell screening and then perform additional based analysis afterwards on different readouts depending on our requirements for this current screen. This comes with challenges of integrating live cell screening and the major challenges that we had were the integration of the device itself into the hybrid platform and also integration with the quality control processes to make this function in order to gain as much insight into the or gain as much information from this screening of live cell across the entire process. We need to utilize bright field imaging and also AI based analysis methods to extract as much information as possible from bright field images. And we need flexible workflows in order to integrate these images into our current data workflows. So what do we need to perform live cell screening? And the first approach is, the first thing we need to do is actually acquire the images. And like I said, this was this device is integrated into our um high throughput platform and this enables us to schedule image acquisitions across across the time period so here’s an example of how we can acquire images across a 24-hour period so we have cell seeding treatment and then incubation period followed by imaging which takes five minutes and then we can image place every hour so on the left you can see a schematic of the a schematic of the automation process where the plates are imaged and then automatically return to the incubator followed by an incubation period of an hour and then we can start on the next plate in order to acquire these over a 24-hour period so this is an example where we could look at 12 plates over 24 hours and this gives us the ability to look at roughly 4 600 different conditions in 384 and if we were to do 1536 this would increase to around 18 000 different conditions that we can monitor over time as you can imagine this is a large amount of data so we need data storage solutions in place in order to process this information and to keep this to store the data and in order to do this we have dedicated storage in proximity to the device, we have daily archiving of the data to ensure data quality over time and you can see here that for this experiment we have four terabytes of data which highlights the need for these data workflows to be in place to enable this to be performed. So how do we handle the data after acquisition? And as I mentioned earlier, we have a heterogeneous population of devices at Evotec, and therefore we have an integrated solution where we have device -specific processing at the initial stage, where after acquisition, the images are acquired and then automatically archived every day. And in order to get these into a format that fits into our workflows, generate xml files which have the associated data from the images to the metadata from the device and then we can feed this images into our standard data workflows that we have at Evotec for downstream processing such as analysis and also feeding into our ai-based segmentation and classification workflows a very useful application of this live cell imaging is also quality control across screening and the imaging allows us to main to basically observe the quality of the screen over time and this allows us to perform for example the quality control of seeding which can be challenging in large high content screening where we have various artifacts or a disruption to the cell layer specifically also can be a challenge for various cell types and here we can use this imaging to get a snapshot after cell seeding and see how the cells are growing and this can be performed using very fast confluency analysis so the images can be acquired and then we can immediately start analysis and give the lab team immediate feedback on the quality of the seeding in the current plate additionally we can monitor the control or the quality control over time during the incubation phase and this allows us to monitor for example cell health over time so how are the cells growing as well as, for example, check for contamination or growth characteristics. And this allows us to, in a faster time, respond to any challenges in the current screen. Additionally, we can look for staining artifacts if we see any effects after staining. And this allows us to take a look very rapidly at the quality of the stain before we go on to additional endpoint readouts. So if we want to check the quality, boom, we can do this as well using the quality control checks. So with the data analysis pipeline, how do we move from images to meaningful insights into the data? So I would like to quickly just go over our image analysis strategy or how we can maximize information gained from images. And here you can see an example of images generated on the Endeavour from bright field imaging on the top left through to generic staining of cellular components. So this is a cell painting style panel where we are staining non-specifically areas of a cell. So for example, we can stain the nuclei with Hirsch, actin filaments with phalloidin staining and mitochondria with mitotrache and lysotrache to stain lysosomal structures. And this enables us to gain information so we can utilize these fluorescent-based approaches to specifically mark up areas of the cell of interest. But how do we actually extract information from these images? And we can use in-house tools developed for detection of individual cells. So normally we start off with segmentation of regions of interest in the cell, so detecting nuclei on the Hirsch channel, and then also detecting the cytoplasm. identify specific regions of interest that we’re interested in such as membrane regions etc so whatever is required for the current assay we have custom in-house built feature extraction methods so which basically we can use to describe the basic readouts of the cells such as basic morphology intensity contrast as well as texture based readouts to extract features from these individual cells and then following this we can put this data into our standardized pipeline to standardize the data, check for quality control, perform profile correction for correcting any plate effects which can be seen in high throughput screening. We can normalize this data per plate to make it normalized so we can compare directly to other plates and also across experimental batches and then we can perform downstream approaches. One approach that we utilize is fingerprint generation and this allows us to unbiasedly describe the characteristic of a cell. So essentially we get many features and this describes the current phenotype of the cell and we can utilize these fingerprints for downstream approaches such as hit identification and hit calling. So on the next slide I will describe briefly how we can utilize these fingerprint-like information. and we can use this to perform for example nearest neighbor analysis and this allows us to identify phenotypes that have or compounds which have similar phenotypic effects on cells and a readout that we can utilize is the nearest neighbor ranking and this basically allows us to rank which compounds are similar to each other And this gives us information on, for example, mechanism of action, where we can then utilize this to observe a mechanism of action of, one, known compounds, and we can utilize our experience with pre-labeled, pre-known compounds, as well as unknown new compounds, and then work out mechanism of action based on these nearest neighbors. Additionally, we can utilize signature-based approaches. where we can identify specific signatures in these fingerprints to reverse, for example, a specific phenotype of interest. And a good example of this is if we have a healthy control versus a disease state, then we can utilize specific signatures inside these fingerprints in order to see which compounds are specifically reversing these effects. We can focus in on feature groups, so which specific features are changing inside these, as well as focusing on more specific readouts such as biosafety point of departure analysis where we can utilize these approaches to see at what concentration do we then see a phenotypic effect. And this allows us to, for an example, to characterize toxicity in cells. As well as this, we can use these fingerprints for more advanced approaches where we can then… the predictive power of the fingerprints to predict the effect of compounds in alternative assays. So we have the ability to utilize these as a predictive model for them predicting alternative assays that haven’t been run on these specific compounds, where we can utilize the fingerprints generated, for example, from this data to predict their potential effect in these other assays, which can be very powerful. enhances the information that we can acquire but as i said we were mostly focused on live cell imaging and with live cell imaging we can use fluorescent based live cell dyes which is possible and we have experience with this however the majority of the time we want to use brightfield imaging one because it’s a very non-invasive technique so we don’t have to add anything to the cells we can just acquire brightfield images and this allows us to monitor the state across several time points One challenge with brightfield imaging can be the proper extraction of meaningful data from the brightfield images due to some various effects such as the lack of a contrast between the foreground and background so you can tell with brightfield it’s yeah the cells are a lot less clear than for example in a fluorescent image where you’re staining specific structures and you have a very dark background this can be a challenge in brightfield and additionally you also have challenges such as illumination profiles across the image and variation between experimental batches and across the plate and therefore to to gain the maximum information from this we utilize um yeah segmentation based models so this is a unit model that we trained in order to segment the cells in brightfield to gain information from this live cell screening approach what this means is we can train the model to identify regions of the image of interest and we can customize these models to basically segment our regions of interest so here this model is able to segment the nuclear segmentation so we can get the nuclear positions as well as the cell body segmentation to basically detect the cytoplasm as well. As well as this we can include the border segmentation and this allows us to segment the borders of the nuclear and the cell body and this allows us to go to towards instant segmentation where we can identify individual cells and individual nuclear which can be seen on the next slide where you can see that we’ve identified individual nuclei and we can get the cell body positions and the nuclear positions from the images. In the middle we can see a hushed staining of this plate so you can see that we’ve managed to identify the nuclei position based from the bright field and this is superimposed onto the nuclei to high accuracy. At Evotec, we can utilize flexible data analysis pipelines in order to extract the information that’s required from the images. And this goes from generalized models to very specialized or specific models that we have trained. So on the very generalized models, we can utilize published models such as cellposts. to perform instant segmentation on for example brightfield and these models are very powerful because they are trained on a very large training data set and function broadly and widely on many different cell types but sometimes we require more specific models and that’s where we can train our for example our specific segmentation model on the endeavor images in order to maximize the accuracy that we can gain from brightfield’s screening And we can also train models for more specific structures, for example. We also have a high focus on neuroscience and therefore we can train models, for example, to detect neurite outgrowth assays where we can detect neurons and neurites growing in bright field images. And we can utilize this lifestyle screening for more specific approaches such as neurite outgrowth assays. As well as segmentation, we can train classification models on these images and later I will show you some examples of cell cycle detection. But we have additionally used fingerprints and images for detection of specific classes or specific phenotypes such as mutagenicity as well as tox prediction as well. i would like to now show you some insights that we’ve gained from live cell screening and how we can utilize this in real life situations and this is an example where we have some example data from mutual rest cells seeded in in a well plate and we have a 12 point dose response that was added to the cells followed by image acquisition every hour for a period of 24 hours to monitor the state of the cells over time and traditionally we can get data for example at the top right this is just a competency graph where we see the effect of the compounds on the the growth rate of the cells over over time and this is an example compound rotolone and you can see with an increase in concentration of the compound, we essentially see a decrease in the growth rate. So the endpoint confluency decreases over time with the top three concentration showing the maximum response here. We can utilize this live source screening to gain additional insights. So not just a simple confluency analysis, we can identify the individual cells and utilize the images to predict the state of the cell. And here is an example where we utilize um yeah ai classification to detect the cell cycle at the various stages of over time over these 24 hour time period and this essentially functions by a more simplified cell cycle progression where the cell is undergoing is in g1 phase for preparing for cell cycle division s phase where the dna content is replicated followed by g2 phase where the cells have then undergone dna replication and then split into the two daughter cells and this analysis can be performed with for example Hirsch staining and this has been performed routinely historically and essentially if you look at the DNA content using Hirsch stain the histogram at the bottom left you can see two distinct phases with a g1 phase in green with the DNA content slightly lower and s phase where the cells are undergoing replication of the DNA and then a G2 phase where the cells have been replicated and you see these two distinct peaks and essentially we can utilize the classification to predict these phases of a cell cycle and that’s what you see at the bottom right with rotinone. We have this is the end point now which we would we can essentially see at the end of the assay so where we see with increasing concentration Rottenone has an effect on the cell cycle and here green corresponds to G1 phase, orange corresponds to the S phase and blue corresponds to the G2 phase and at the three highest concentrations we essentially see an increase in the G2 phase cell cycle arrest which is what we would expect to see from Rottenone as a proof of concept and you can see that in the graph as well. Where the extra information comes from live soil screening is we can monitor this effect over time and here we see two concentrations of rotolone where at a lower concentration of 2.5 nanomolar we don’t see much effect on the cell cycle. We see a slight increase in G1 phase at the beginning of the experiment and then we basically move into a standard approach where we see no effect on G2 phase arrest whereas at the higher concentration we see Essentially, we don’t see this G1 phase expansion. We see a G2 arrest that happens at an earlier time point. And we also see an accumulation of dying cells at the bottom. And these are very bright cells that are detected, which potentially could be washed away at the endpoint analysis. And this is why potentially we can see this increase in dying cells. And this gives us extra information from the live cell approach to see the effect over time and see when the compound starts to have an effect at what concentration. This approach additionally allows us to gain increased information on these middle concentrations where we don’t see a very strong effect at the end time point but potentially they have a different effect at an earlier time point. So here I’ve highlighted this middle concentration of rutinone and here at the end point we didn’t see a large effect on G2 phase inhibition and here you can see kind of a greater effect on an earlier time point followed by recovery. So you see a slight effect on G2 phase rest, but then we see recovery over time. And this is potentially why we don’t see the effect at the end time point, but we do see it in the live cell data and you see it in the competency data as well, where the cells are slower to grow. And this shows us that we can gain additional insights by looking at multiple time points during the screen into the cell, the phenotype and giving us more information. we can’t look into individual compounds so how do we translate this into a hit calling approach and for example this is a way we can utilize this data where on the y-axis we have percentage of cells in the g2 phase and here we can basically set a threshold or a cutoff and then identify hits which are compounds that are affecting for example due to arrest in cells and we can utilize this to monitor compounds or new interest compounds of interest and their effect on the cell cycle We can also look at the time point of when these compounds start to have a phenotype. And this can be seen with the color scale. So blue is early time points and red is the late time points. And here I’ve highlighted two compounds, Paxilataxel, which is known to invoke G2 arrest by disrupting the microtubial dynamics. And here you can see that it’s active across multiple time points. So we can see this phenotype in a G2 arrest at a very early stage. Whereas, for example, delanzamib is also a known G2 arrest proteasome inhibitor, so it has a different mechanism of action. But with this analysis, we only see this at a later time point, which indicates that we can characterize which compounds are active at which time points. As well as looking at specific readouts or specific classes, such as a cell cycle, we can additionally gain unbiased image or unbiased snapshots into the phenotype of the cell. And this utilizes a cell painting like analysis, which I should describe earlier with the extraction of fingerprint information from the images. So this slide demonstrates that bright field imaging has a large amount of extra information. that we can utilize to describe the phenotype of a cell. So at the top we can see an example where we have cell painting, the full cell painting panel as described earlier, so we are marking up the nuclei, the acting structures and additionally the lysosoma mitochondria and the bright field imaging and here we see a very strong clustering of mechanism of action in for example a TISNI. dimensional reduction plot and on these plots on the on the left hand side you can essentially see landmark compounds where we know the mechanism of action and you can see the clustering based on color and this is clustering based on similar mechanisms of action so these compounds have similar phenotypes and they show very strong clustering with these with the cell painting panel as expected. On the bottom you can see the effect of just using the brightfield information And you can still see very strong clustering in the brightfield images, indicating that the brightfield images have a large amount of information inside of them onto the mechanism of action. And we can utilize these brightfield images to then gain early information into mechanism of action, for example, during the screening process and additionally at several time points. So we can utilize these approaches to observe compound effects over time. So this is an example of the mechanism of action over time. And you can observe on the left an early time point mechanism, where if we look at a very early time point, we basically see very limited structure in the data, indicating that we have low activity, not very strong phenotypes. There’s some clustering, for example, early clustering of proteasome and tubulin compounds, but very little other structure. As we increase the time period into the early middle time point, then we start to see an increase in the amount of information that we can gain. or the increase in the phenotypic response of the cells. And here we can observe increased clusters, for example, the increase in the amount of clusters that we can identify. And as we move into the middle late time point and the late time point, we can observe a large amount of clustering and we can utilize this information to then gain additional insights into compound effects over time during the entire screening process. Here is the example of the two compounds that I mentioned earlier in the cell cycle analysis. And as you can remember, the paxelotaxel had an effect at an earlier time point, whereas the lansomib only showed an impact on a G2 phase at a later time point. For utilizing these approaches, we can observe the effects of these compounds over time. And at the earlier time point, you can see very limited clustering of these two compounds into their mechanism of action clusters. But at the early time point, we can see very strong clustering of both the compounds into their respective clusters of tubulin effectors, which makes sense for Paxilotaxol as a microtubular inhibitor, and also a clustering of the Lanzamib into its proteasome cluster. And this gives us insight that with this unbiased approach, we can gain additional information from the compound effects at an earlier time point than looking at, for example, just one readout, such as a G2RS. This highlights the power of this technique to extract additional information from the bright-filled images and to acquire information across the entire stage of the screen using live cell imaging. And with that, I would like to summarize what we’ve shown you today. So I’ve shown you the integration of the Endeavor imaging system into our high throughput screening platform. I’ve shown you how this can increase our capabilities in the area of live cell screening. How can we monitor cells over time and gain additional insights into their biological action? I’ve shown you how this enables the integration of the Endeavor also enables us to increase our scale of performing throughput screens and how we can utilize this for quality control of the imaging so we can utilize the quality control over time and how we can utilize AI-empowered data workflows to extract as much information as possible from the bright field and gain additional mechanism of action into the compounds before the endpoint assay. With that, I would like to thank you for your attention.
What does this video cover?
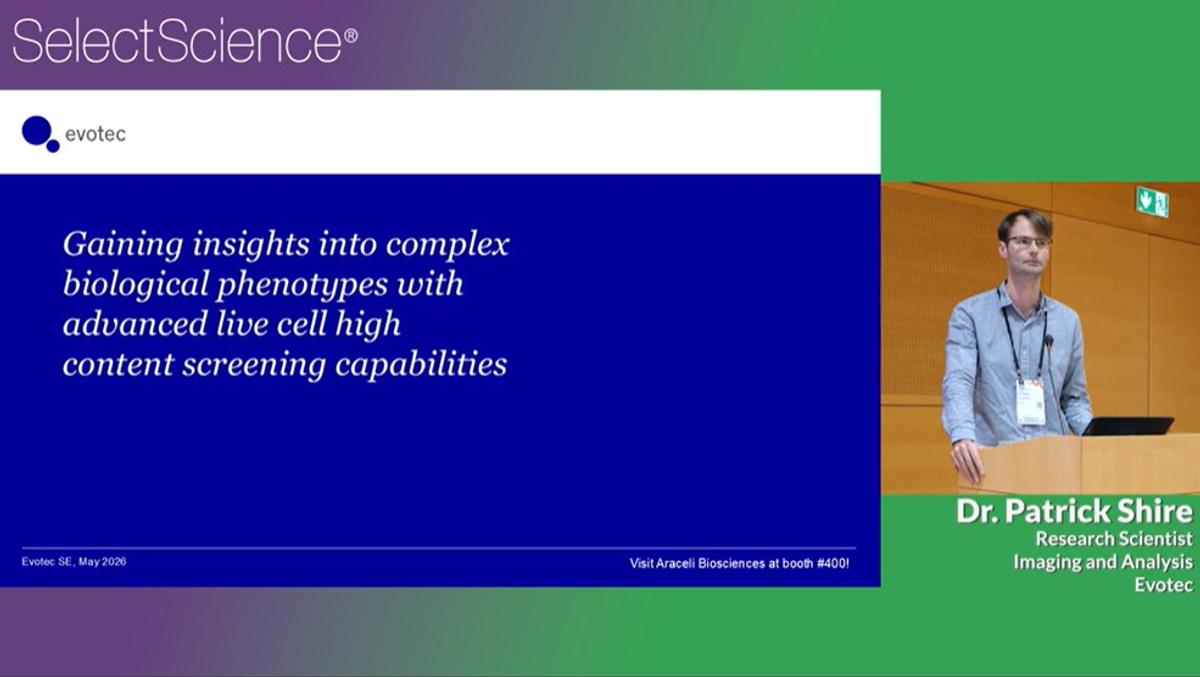
Dr. Patrick Shire presented at SLAS Europe 2026
Topics covered in this video
- How does live-cell brightfield imaging combined with AI-driven segmentation improve mechanism-of-action analysis compared with traditional endpoint assays?
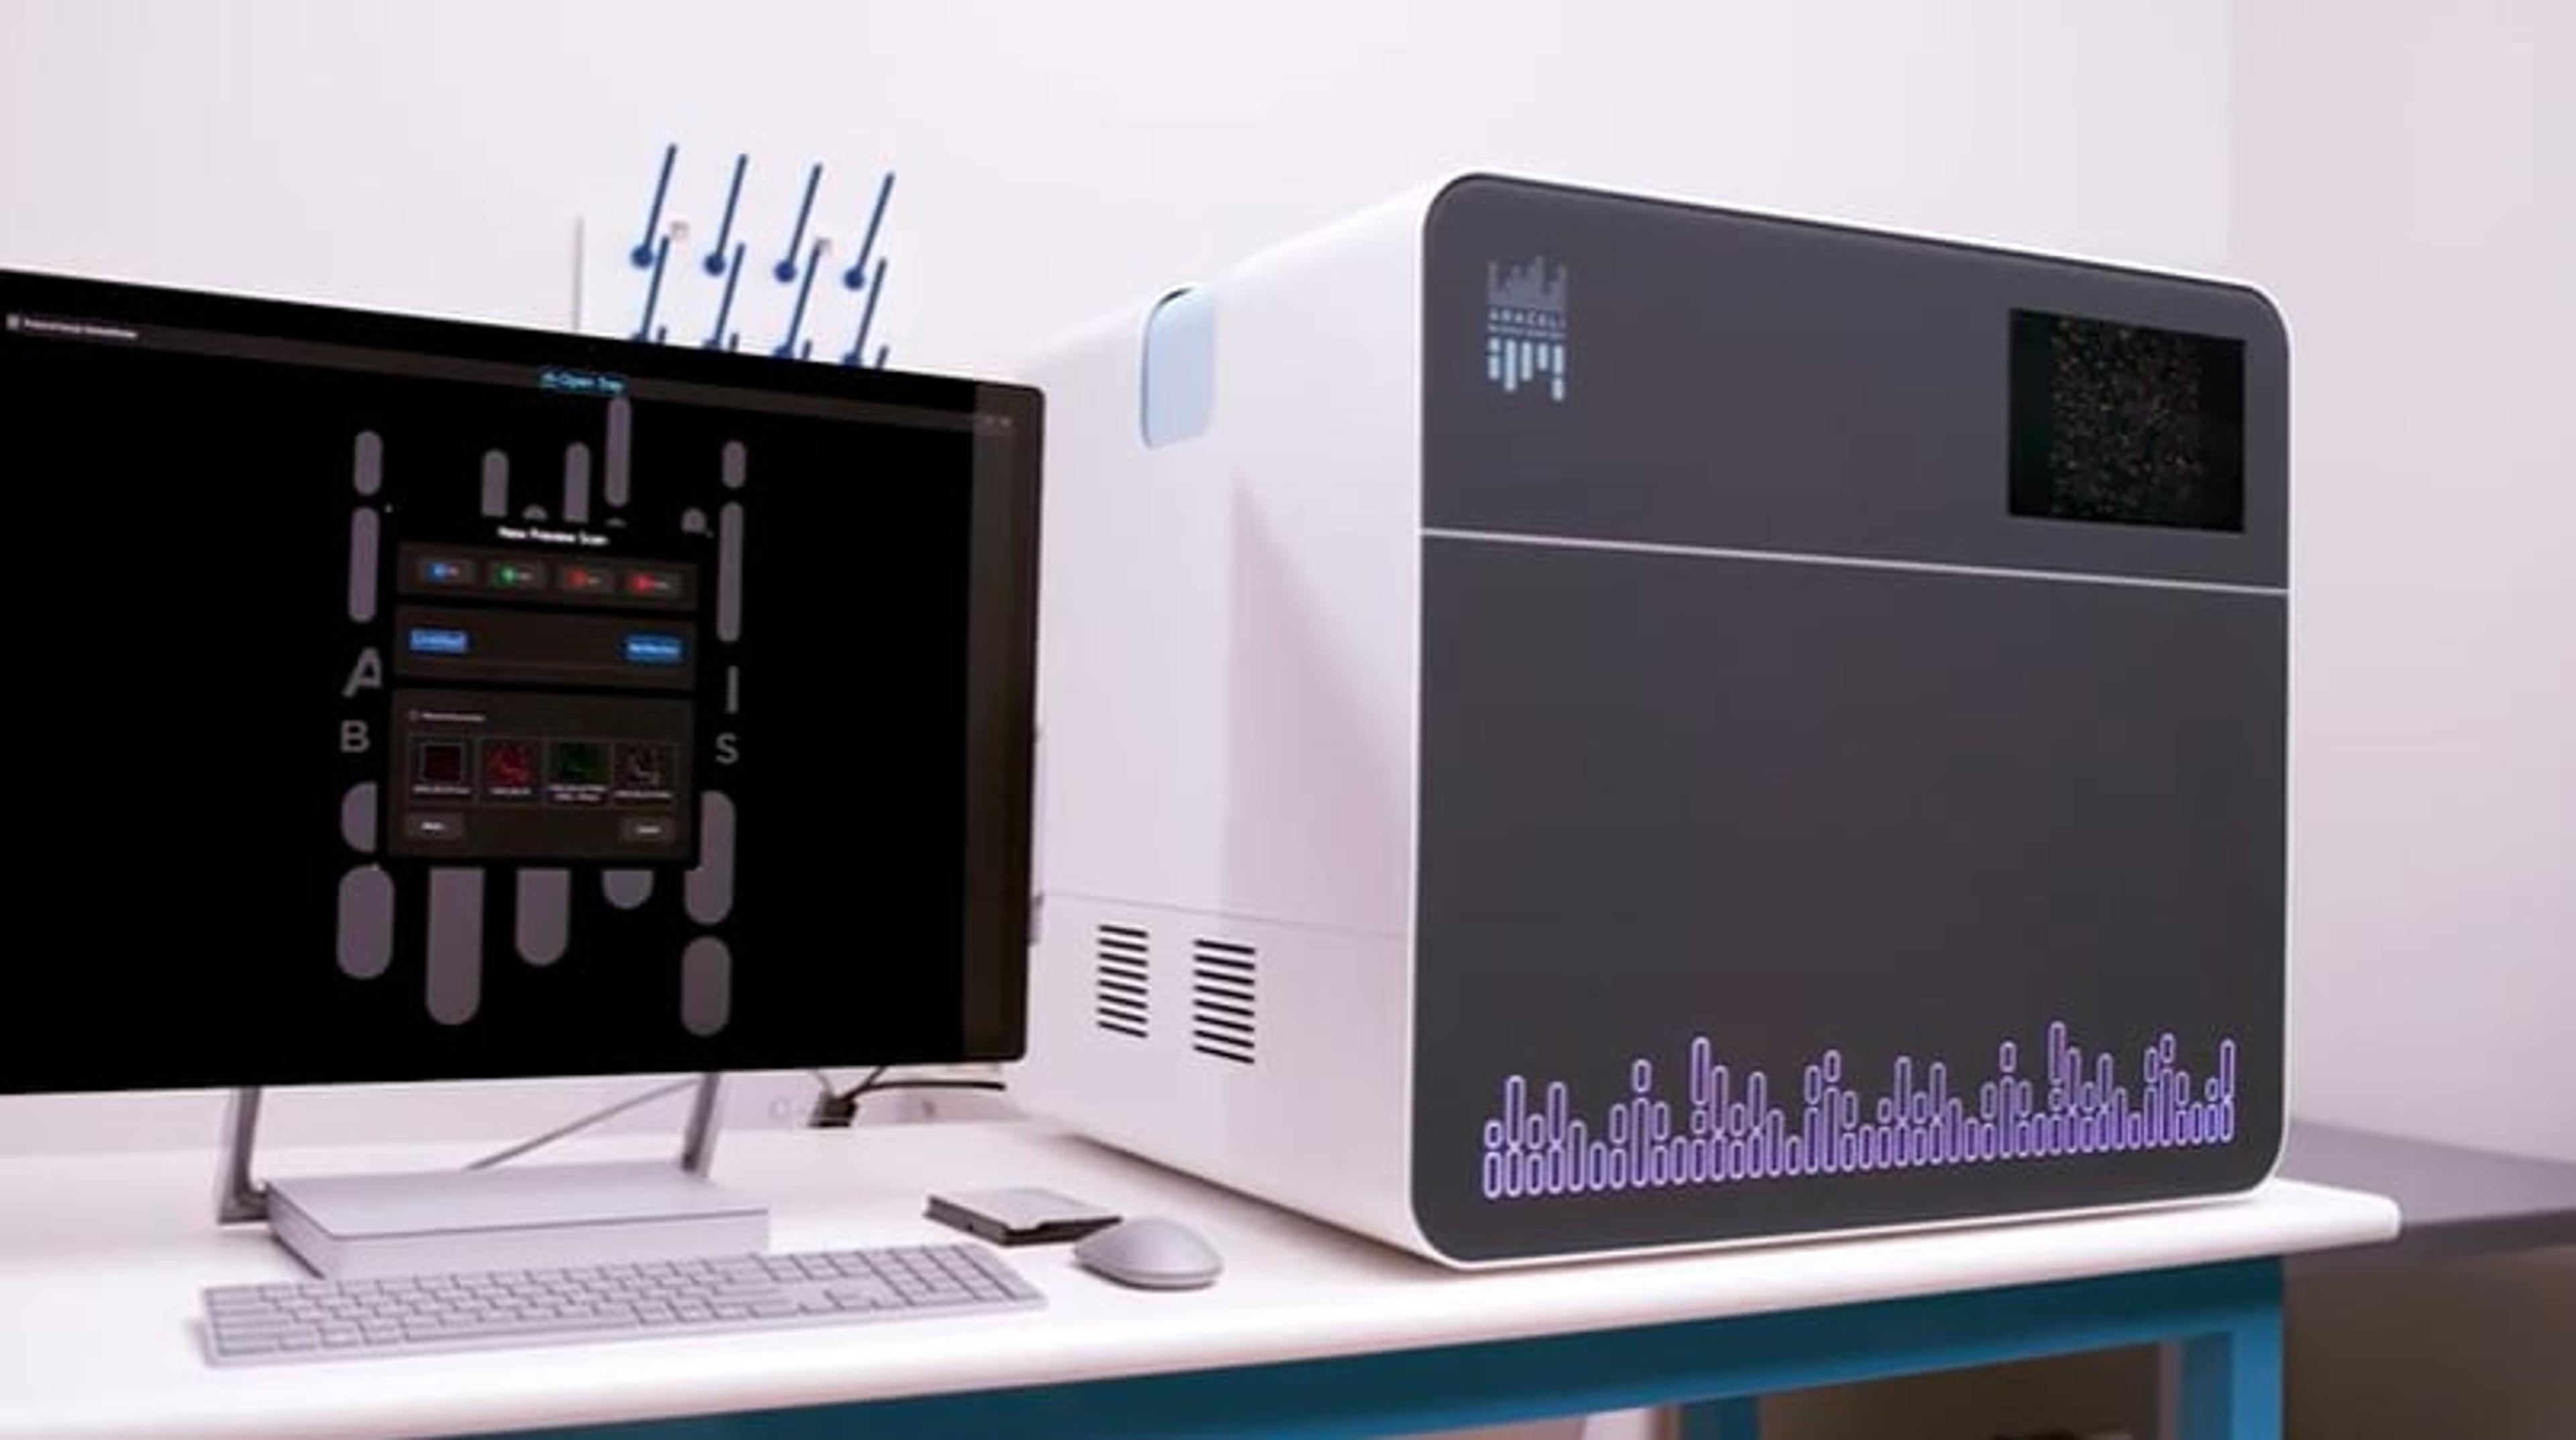
- How has Evotec integrated the Endeavor Pro ultra-fast imaging platform into its automated workflows?
- What are the advantages of using the Endeavor Pro for high-throughput, high-content imaging and screening?
- How do automated plate handling, live-cell quality control, and AI-powered data analysis work together to extract richer biological insights from live-cell imaging data?