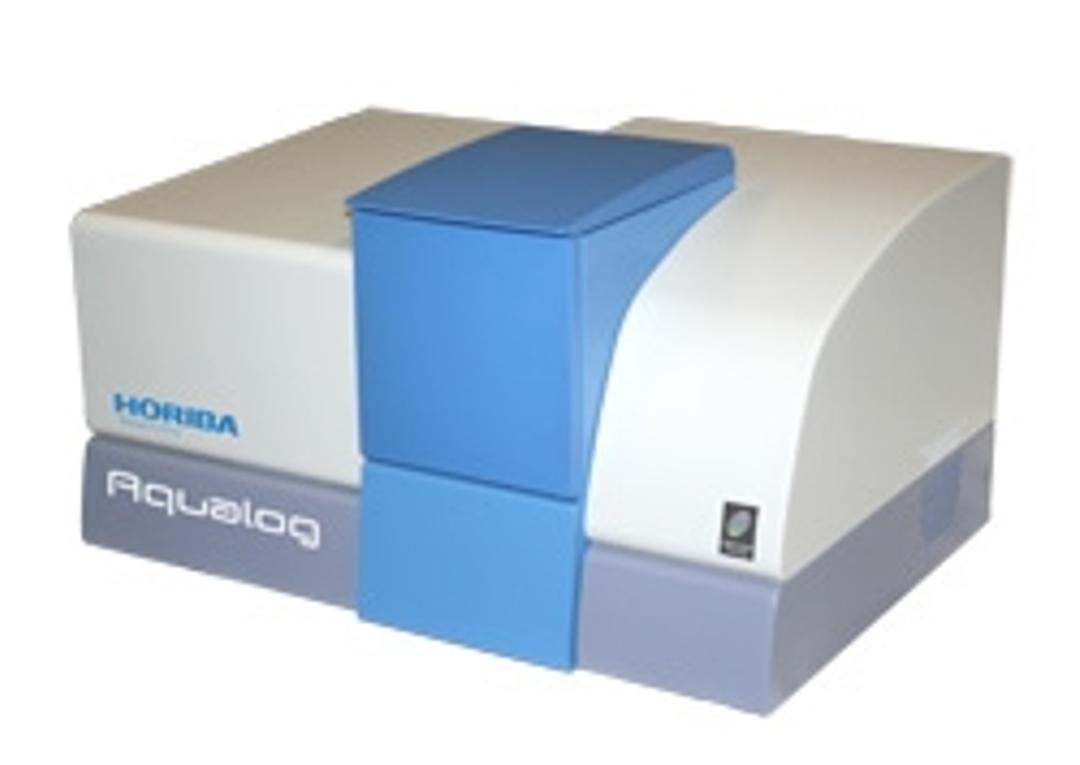
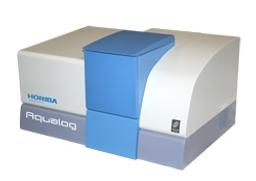
Aqualog® - The compact, Benchtop Fluorometer for CDOM
The Aqualog is a fluorescence instrument for rapidly measuring and identifying CDOM in water. The measurement is based on fluorescence excitation-emission matrices (EEMS) corrected for all instrumental factors. These corrections require an absorbance measurement to also be performed on the water sample. Key features:• The only instrument to measure both fluorescence and absorbance spectra in a single instrument for water quali…

The supplier does not provide quotations for this product through SelectScience. You can search for similar products in our Product Directory.
The Aqualog is a fluorescence instrument for rapidly measuring and identifying CDOM in water. The measurement is based on fluorescence excitation-emission matrices (EEMS) corrected for all instrumental factors. These corrections require an absorbance measurement to also be performed on the water sample.
Key features:
• The only instrument to measure both fluorescence and absorbance spectra in a single instrument for water quality analysis
• Up to 100 fold faster data acquisition rates than any other benchtop fluorometer
• Table-top instrument based on a CCD detector for fast simultaneous readout of the entire emission spectrum
• Software routines automatically correct data for inner filter effects, Rayleigh line scattering, water Raman scattering, normalize the intensity scale, and export data for analysis in industry standard 3rd party packages
Its main benefits are:
• Table-top instrument based on a TE cooled CCD detector for fast simultaneous readout of the entire emission spectrum, means less analysis time or more samples
• Analysis of samples with orders of magnitude variation in concentration without the need for tedious dilutions
• Eliminating sample aging, bleaching and dilution issues as experimental variables. AqualogTM measures fully corrected EEMs in seconds. Rapid acquisition reduces bleaching compared to ‘scanning’ instruments that require up to 100 times longer data collection, exposing the sample to damaging UV wavelengths the whole time
• The instrument is fully automated
• Software: The Aqualog software automatically:
- masks the Rayleigh scatter lines
- normalizes to traceable intensity standards (Quinine Sulfate or Raman Scattering)
- offers 2-dimensional profiling of the ‘integrated’ excitation and emission spectra from EEMs
- corrects and batch exports the data for multivariate analysis using the industry standard Parallel Factor Analysis (PARAFAC) method, reducing data analysis time by a factor of ten
• Corrected UV-VIS absorbance detection path for stability and accuracy
• Double grating excitation monochromator for superior stray light rejection
• Matching bandpass for absorbance and fluorescence spectra
• The optics: We only use aberration-corrected mirrors (no lenses) to increase the wavelength range, for you cannot get good anti-reflection coatings from 200 nm up through 850 nm or above. Lenses also suffer from chromatic aberrations, meaning different wavelengths focus at different depths in the samples, and consequently you lose sensitivity
• Gratings: HORIBA, previously known as Jobin Yvon, has been designing and making ruled and holographic gratings for over 50 years. We use plane-ruled gratings in our instruments as opposed to cheaper holographic ones, because ruled gratings are much less dependent on polarization effects
• The excitation source is a 150 W ozone-free xenon lamp. It is mounted vertically to prevent sagging and keep the illumination of the sample optimal
• A photodiode reference detector monitors the intensity as a function of time and wavelength to correct for any change in output due age or wavelength, and ensure more repetitive measurements. This reference detector enables to correct both absorbance and fluorescence detector signals

EPA Stage 2 Disinfection Compliance with Aqualog
This application note describes the use of the Aqualog for monitoring regulated Dissolved Organic Matter (DOM) and disinfection by-product issues for drinking water treatment. The Aqualog was used to imultaneously measure the UV-VIS absorbance spectrum and fluorescence excitation emission matrix (EEM) and monitor DOM pertaining to EPA Stage 2 Disinfection By-product Rule (DBPR2) compliance in a typical surface water source drinking water treatment plant (defined as Subpart H) .
Fluorescence Spectroscopy and Water Quality
Discover how excitation-emission matrix (EEM) fluorescence spectroscopy can be used to determine the amount of dissolved organic matter (DOM) contamination in water. The FluoroMax spectrofluorometer from HORIBA Scientific is shown to enable fast and accurate DOM analyses.
CDOM Analysis using the Aqualog from Horiba
Identifying and quantifying natural and man-made colored dissolved organic matter (CDOM) components is necessary for understanding water quality. The Aqualog system from Horiba is able to rapidly and accurately measure CDOM. Watch this video to learn how the Aqualog simultaneously measures both absorbance spectra and fluorescence Excitation-Emission Matrices (EEMs).


The A-TEEM: Combining Absorbance and Transmission with EEMs
HORIBA Scientific, a global leader in fluorescence solutions, has a new technique for molecular fingerprinting