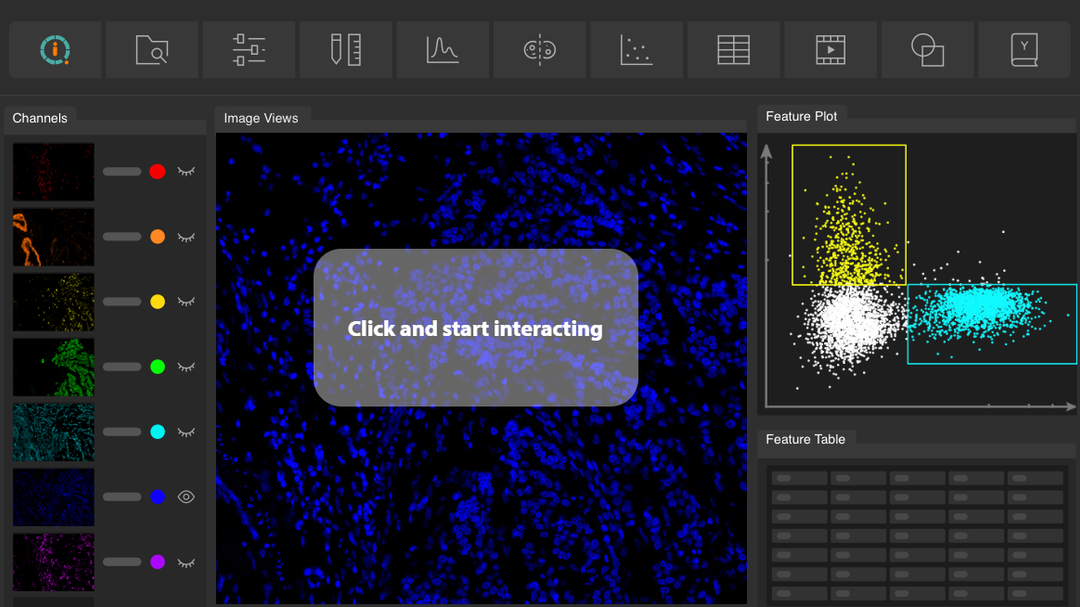
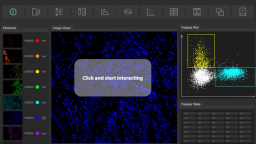
MACS® iQ View
MACS iQ View Analysis Software is the ship to navigate the ocean of multiomic data in your spatial biology experiment on the revolutionary new MACSima Platform. It enables you to make complex data comprehensible by putting sophisticated, powerful analysis at your fingertips.

The supplier does not provide quotations for this product through SelectScience. You can search for similar products in our Product Directory.
Specifically developed to analyze the enormous data stacks obtained by the MACSima™ Platform, the MACS iQ View Analysis Software allows scientists to tap the full potential of spatial biology. Its versatility and intuitive user interface makes it an ideal tool to analyze the multidimensional multiomic datasets gathered during MICS (MACSima Imaging Cyclic Staining) experiments, and to extract the underlying information in an easy and comprehensive manner.
Key features:
- Easy segmentation: Predefined segmentation options based on proven and fast algorithms let you start with your analysis at once. Alternatively, you can flexibly use your own trusted segmentation mask.
- Flexible gating and clustering: Phenotype your cells based on biomarker expression, location, or cell shape properties – either through your favorite gating strategies or unbiased methods such as k-means clustering.
- Smooth analysis workflow: Analyze your spatial biology data comprehensively by multiple workflows. The workflow editor allows you to organize your analysis steps visually in an intuitive manner. Easily apply stored analysis workflows to other datasets.
- Advanced plotting options: MACS iQ View offers sophisticated plotting options and analysis tools, including dimension reduction plots (t-SNE plots, UMAP) and distance mapping.
Interpreting complex spatial biology data through unsupervised data analytics
Wednesday October 1, at 19:00 BST | 20:00 CEST | 14:00 EDT | 11:00 PDT
A single tissue section represents a cellular and molecular landscape of extraordinary complexity, waiting to be explored. However, past approaches have only tapped into a small fraction of the information hidden in their protein expression halting insights and clouding biotherapeutic discovery.
With advances in multiplexed imaging and cyclic staining technologies, researchers can now visualize dozens, and even hundreds of protein targets within a single tissue section. While this opens the door to unprecedented biological detail, it also introduces a significant challenge as we try to interpret and understand the vast amounts of data collected from the tissue.
In this webinar, Dr. Kevin Rychel-Penn, a spatial biology data scientist at Miltenyi Biotec, will demonstrate an advanced analysis workflow using 61-plex protein expression data from a colorectal carcinoma tumor microenvironment. Through cellular segmentation, dimensionality reduction (UMAP), clustering, spatial structure identification, and distance mapping, he will show how meaningful, high-impact insights can be extracted from complex tissue datasets.
Key learning objectives:
• Discover how to maximize the scientific value of your histology samples by using cyclical staining with the MACSima™ Platform on a large panel of antibodies.
• Understand how you can identify major expression patterns using unsupervised approaches to let the data guide your cell typing workflow.
• Learn how to use MACS® iQ View software to explore the spatial context of each of your cell types of interest with distance maps and structure identification.
Who should attend?
• Scientists and researchers in academia, biopharmaceuticals, biotechs and CROs who are utilizing spatial biology in their research workflows.
• Data scientists interested in unsupervised cell-typing approaches and spatial analysis methods.
• Immunologists, pathologists and cancer researchers interested in ways to explore the spatial context of tissue microenvironments.
Certificate of attendance
If you attend the live webinar, you will automatically receive a certificate of attendance, including a learning outcomes summary, for continuing education purposes.
If you view the on-demand webinar, you can request a certificate of attendance by emailing editor@selectscience.net.