Cary WinFLR Software
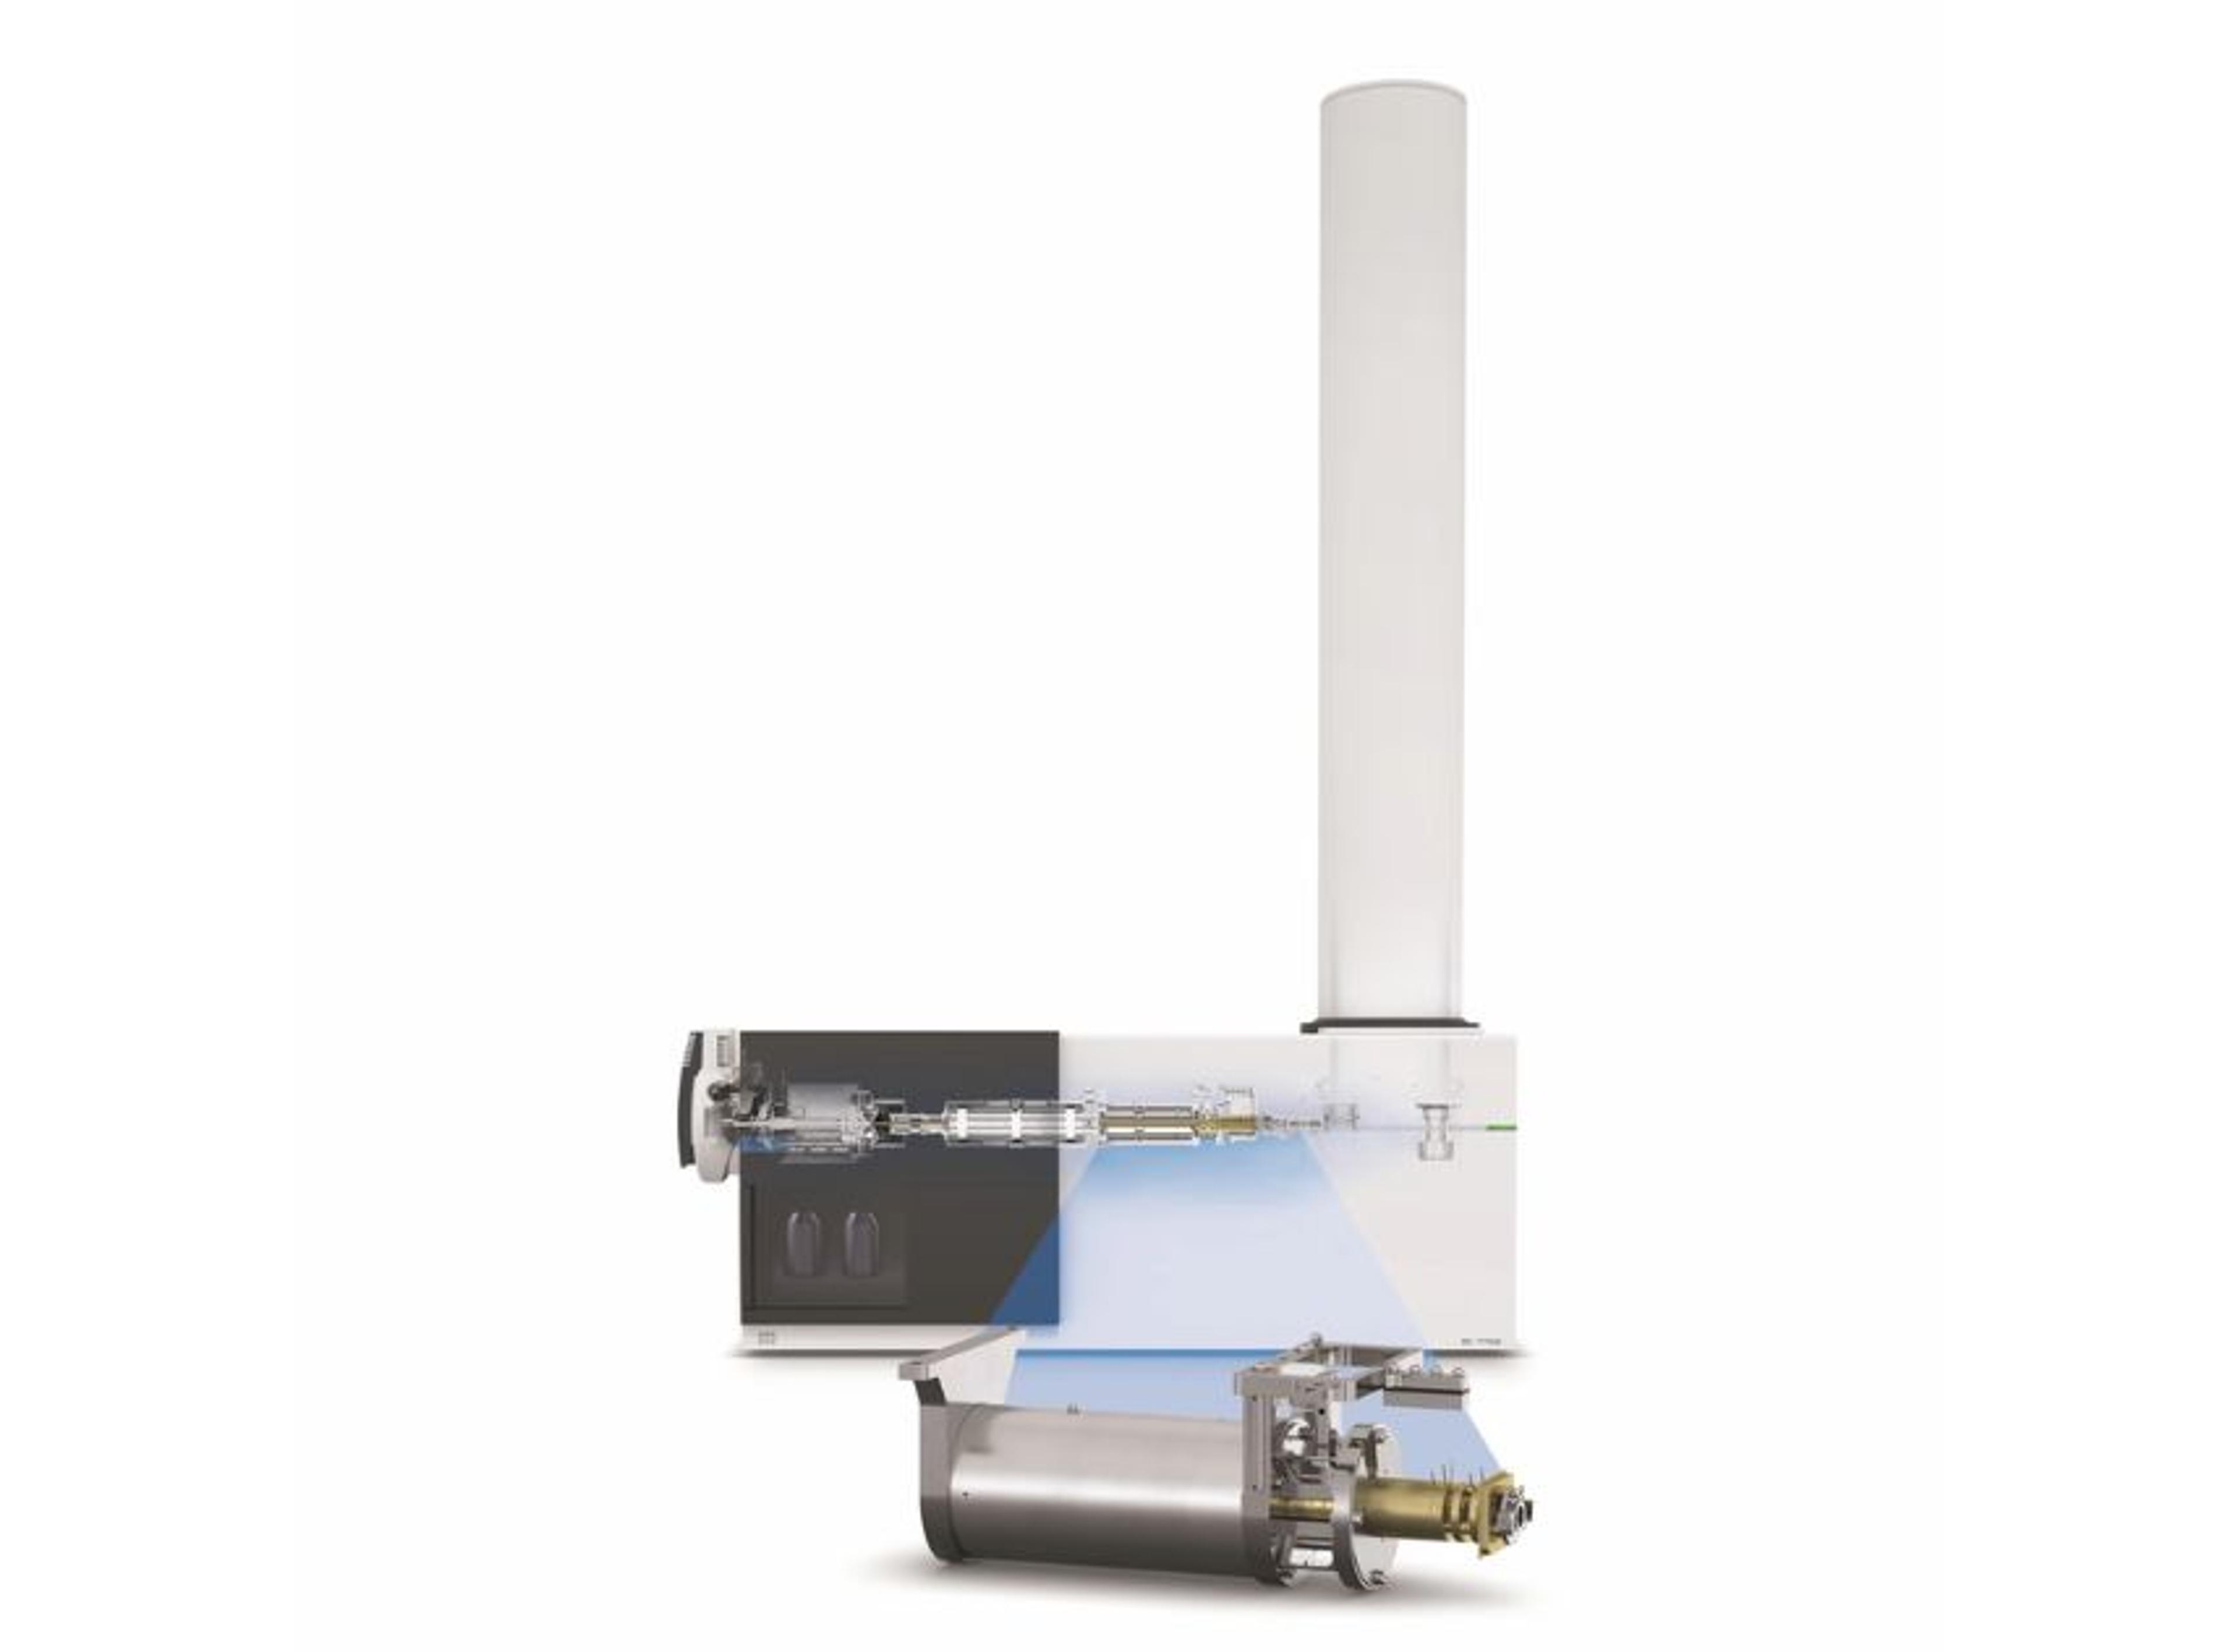
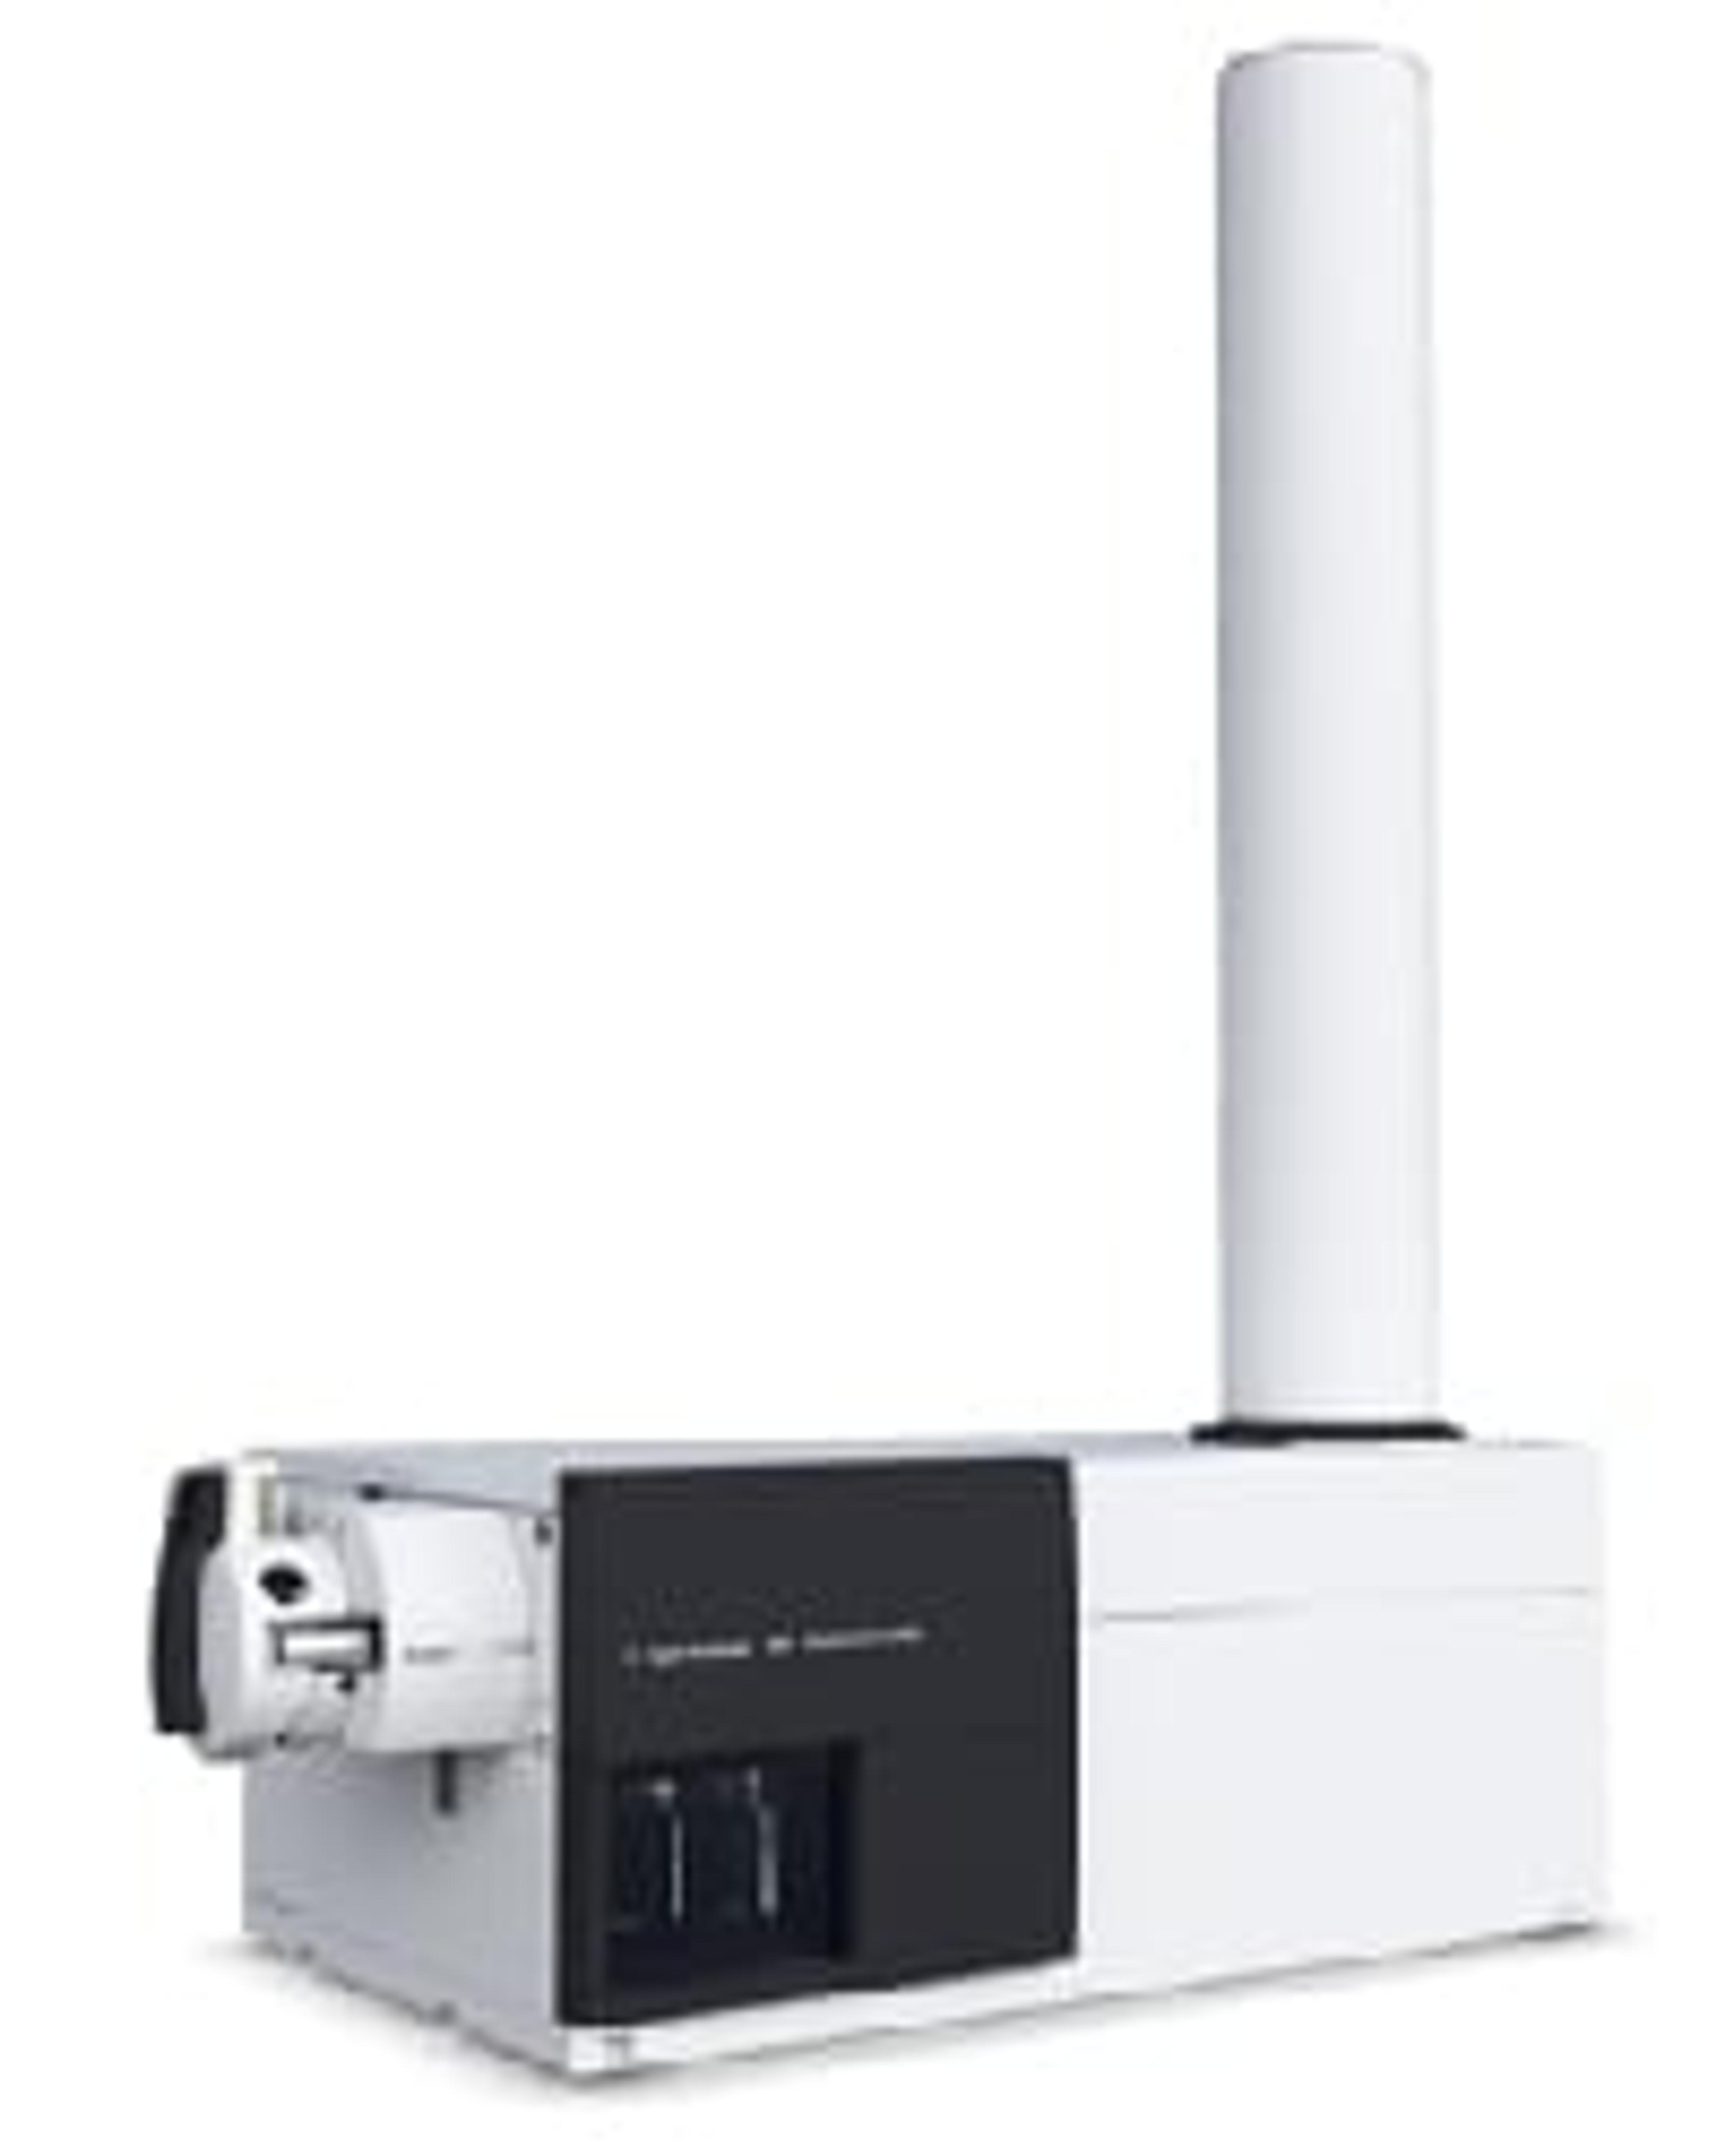
The Agilent Cary WinFLR fluorescence software package for the Agilent Cary Eclipse fluorescence spectrophotometer provides instrument control and analysis capabilities for fluorescence, phosphorescence, chemiluminescence, and bioluminescence.


Receive your quote directly from the manufacturer.
It is great softwere
Fluorescence, phosphorescence, and bioluminescence/chemiluminescence
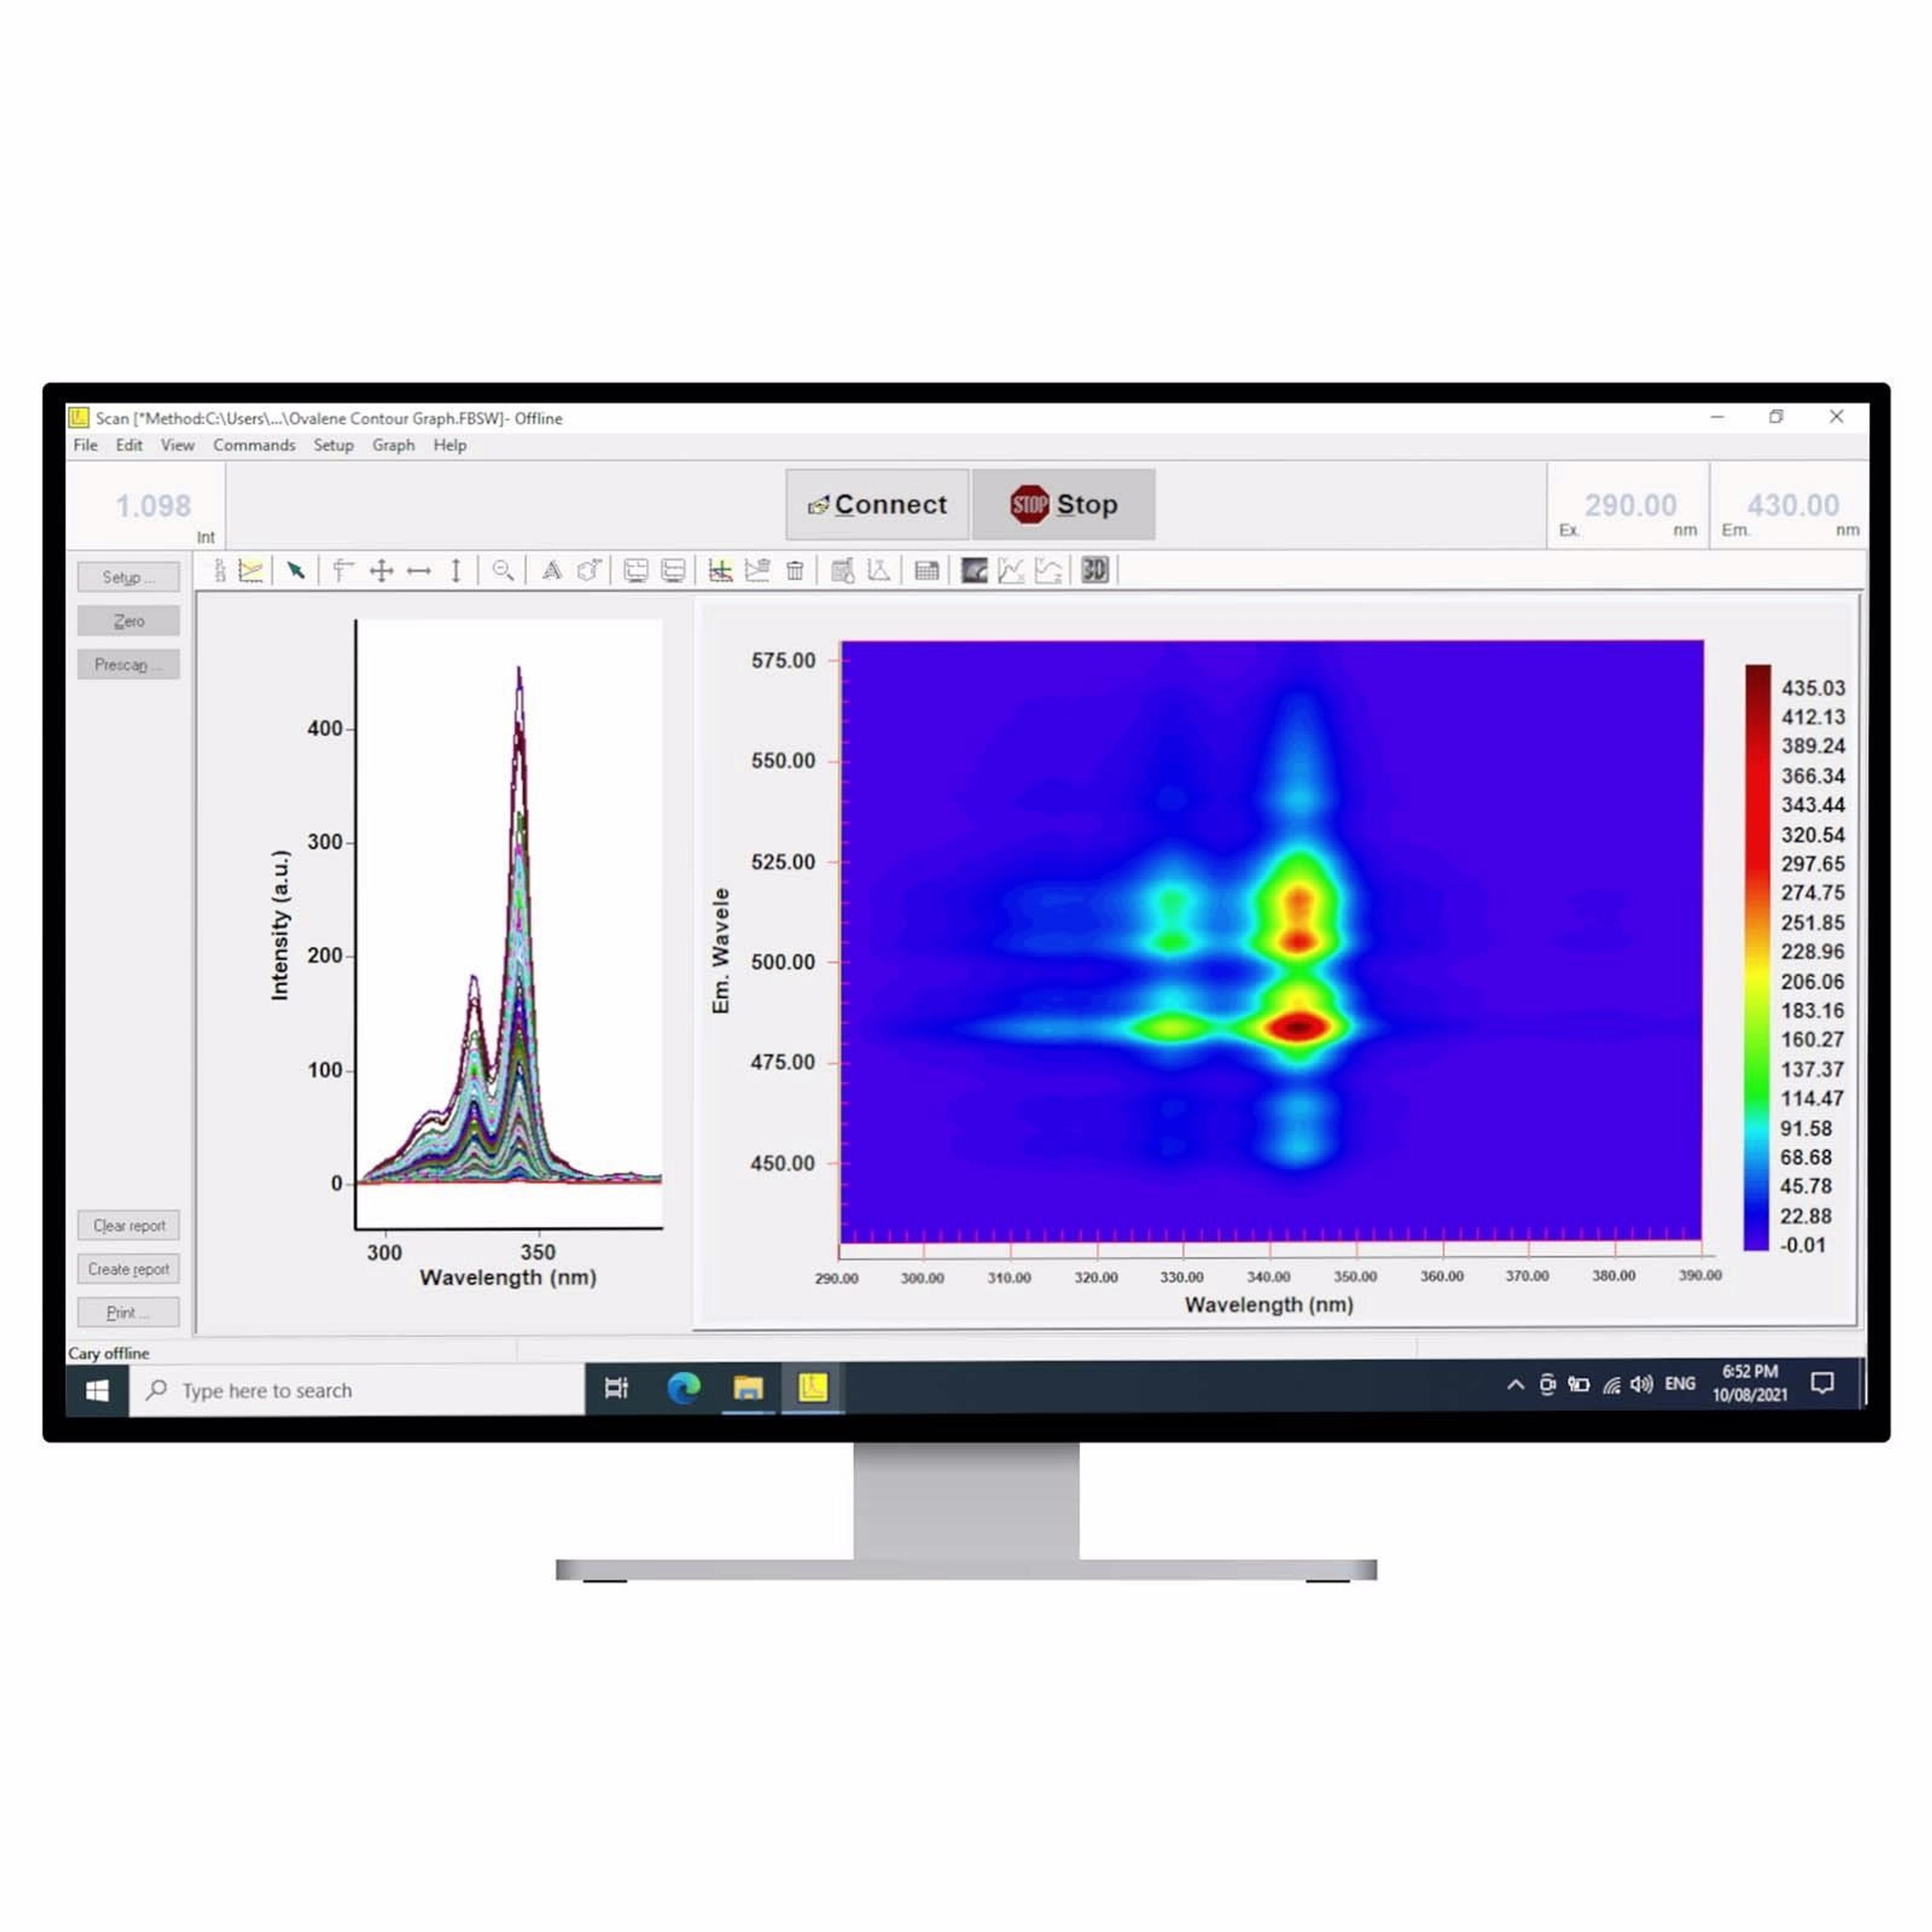
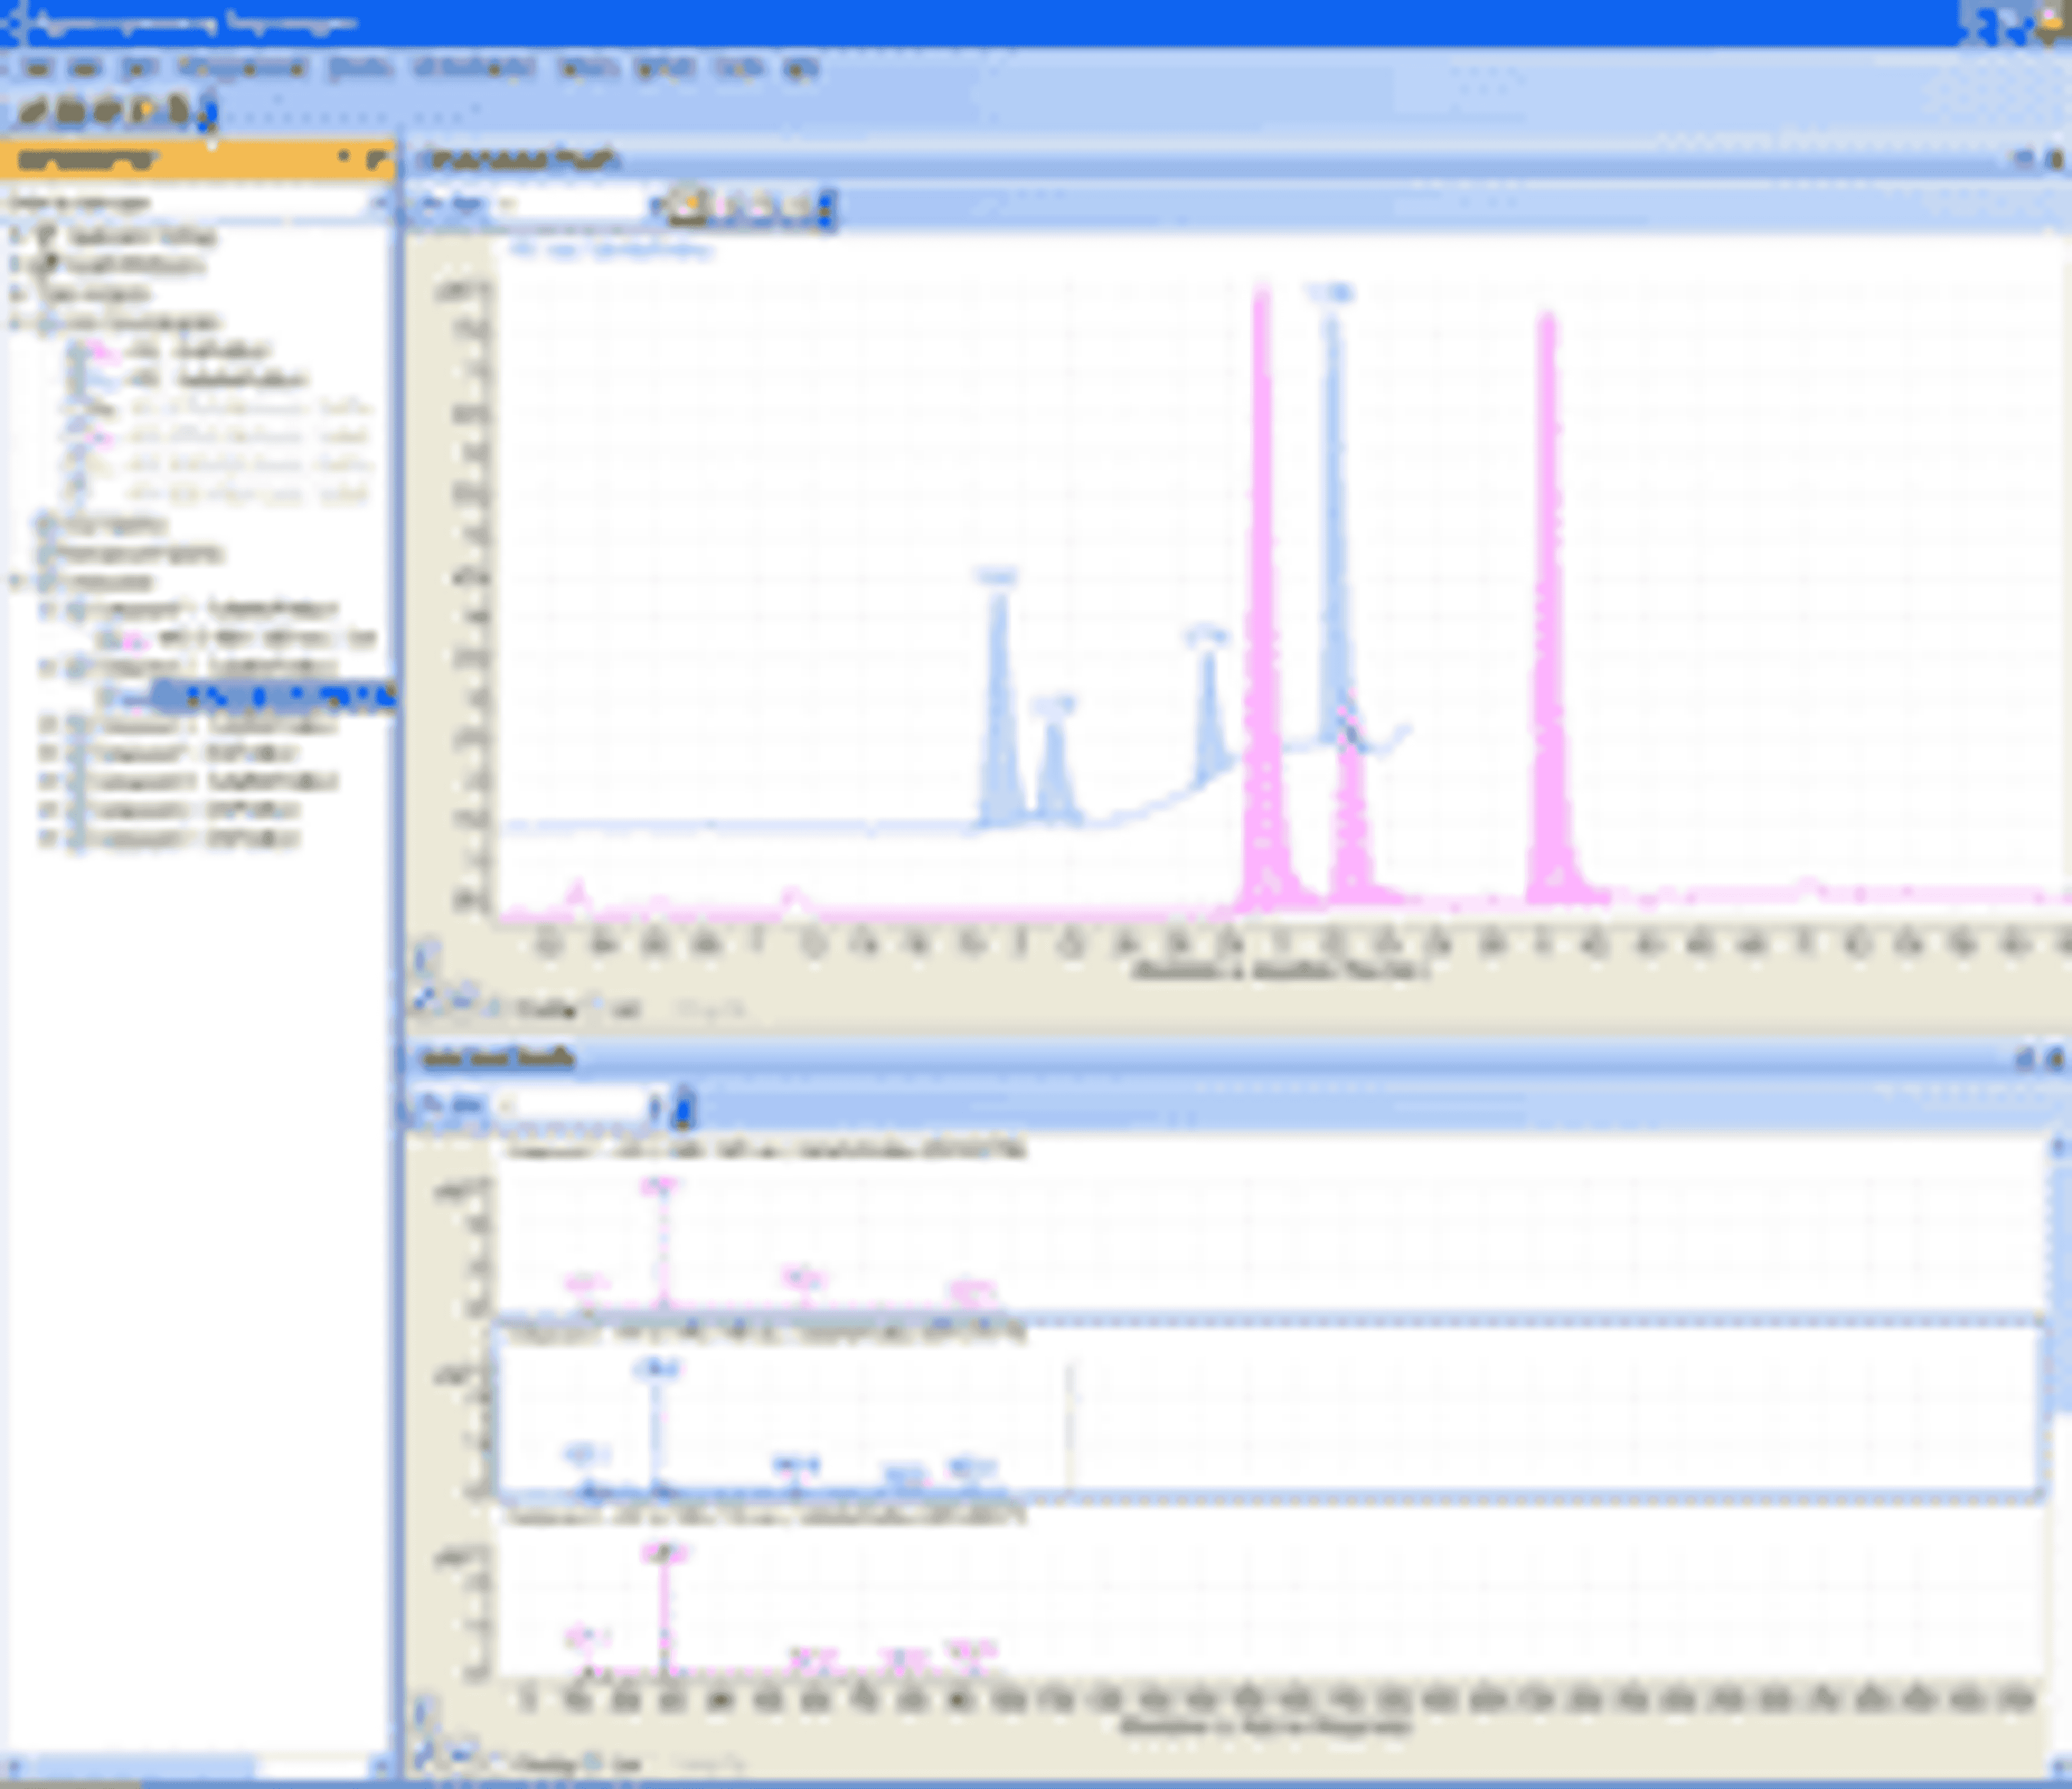
Toolbars assist quick access to the most common operations, including zooming, cursor, adding text, changing axis ranges, drawing contours, and previewing reports. You can easily cut and paste graphs, bitmaps, and text into any word processing package. 3D graph or contour plot are available. The 3D mode automatically collects a series of excitation, emission, or synchronous scans. Applications Development Language (ADL) automates laboratory measurements. All method and report parameters, calculations, graphical displays, and the actual data are stored in one file. Automatically export data to a spreadsheet at the end of the measurement.
Review Date: 28 Mar 2025 | Agilent Technologies
The application-driven software provides scanning, wavelength reads, kinetics, and concentration determining functionality, as well as lifetimes and thermal analysis. The Cary WinFLR software also includes a validation mode and can be used with ADLs (Advanced Development Language) for customized workflows.
Features
- Fluorescence, phosphorescence, and bioluminescence/chemiluminescence modes available.
- Toolbars assist quick access to the most common operations, including zooming, cursor, adding text, changing axis ranges, drawing contours, and previewing reports. You can easily cut and paste graphs, bitmaps, and text into any word processing package.
- 3D graph or contour plot are available. The 3D mode automatically collects a series of excitation, emission, or synchronous scans.
- Applications Development Language (ADL) automates laboratory measurements.
- All method and report parameters, calculations, graphical displays, and the actual data are stored in one file.
- Automatically export data to a spreadsheet at the end of the measurement.