GeneTools and GeneDirectory used at Major Animal Research Centre
12 Jan 2009Product news
Syngene, a world-leading manufacturer of image analysis solutions, is delighted to announce its GeneTools and GeneDirectory automated DNA and protein gel analysis software packages are being used in a world-leading equine research centre at the University of Lincoln in the UK. The software is being used to accurately quantify and identify protein trends in a debilitating equine disease.
Researchers in the Department of Biological Sciences at the University of Lincoln are using GeneTools to quantify proteins derived from muscle and blood of horses suffering from Equine Exertional Rhabdomyolysis (EER) run on 1D SDS PAGE gels reverse stained with copper dye. The scientists are then using GeneDirectory to determine which of the thousands of proteins present are linked to this condition. They hope this study will provide information to produce a diagnostic test for EER.
Emma Banfield, a researcher in the Department of Biological Sciences at the University of Lincoln said: “EER is a very serious disease in competition and race horses as it not only leads to a loss of performance but can also result in necrosis of skeletal muscle tissue. Currently, the only method of diagnosing this disease is to use a muscle biopsy, which is invasive and painful. By looking for specific proteins in the muscle and blood of horses that are suffering from EER, we are hoping to identify any trends associated with this disease which will lead to being able to diagnose this condition with a simple blood test.”
Emma continued: “This is why we need software which can accurately quantify small amounts of protein on gels and then allow us to group all these proteins together to see any trends, and this is why we chose to use GeneTools and GeneDirectory.”
Laura Sullivan, Syngene’s Divisional Manager stated: “Syngene is well known for providing high performance image analysis systems so it is very pleasing to see the software behind these being used for such an interesting application. The research at the University of Lincoln shows Syngene’s software is so good it can be used on its own to accurately detect similarities in vast numbers of proteins making GeneTools and GeneDirectory an excellent choice for use in animal or human genetic studies.”
Related products
Request Quote for All Products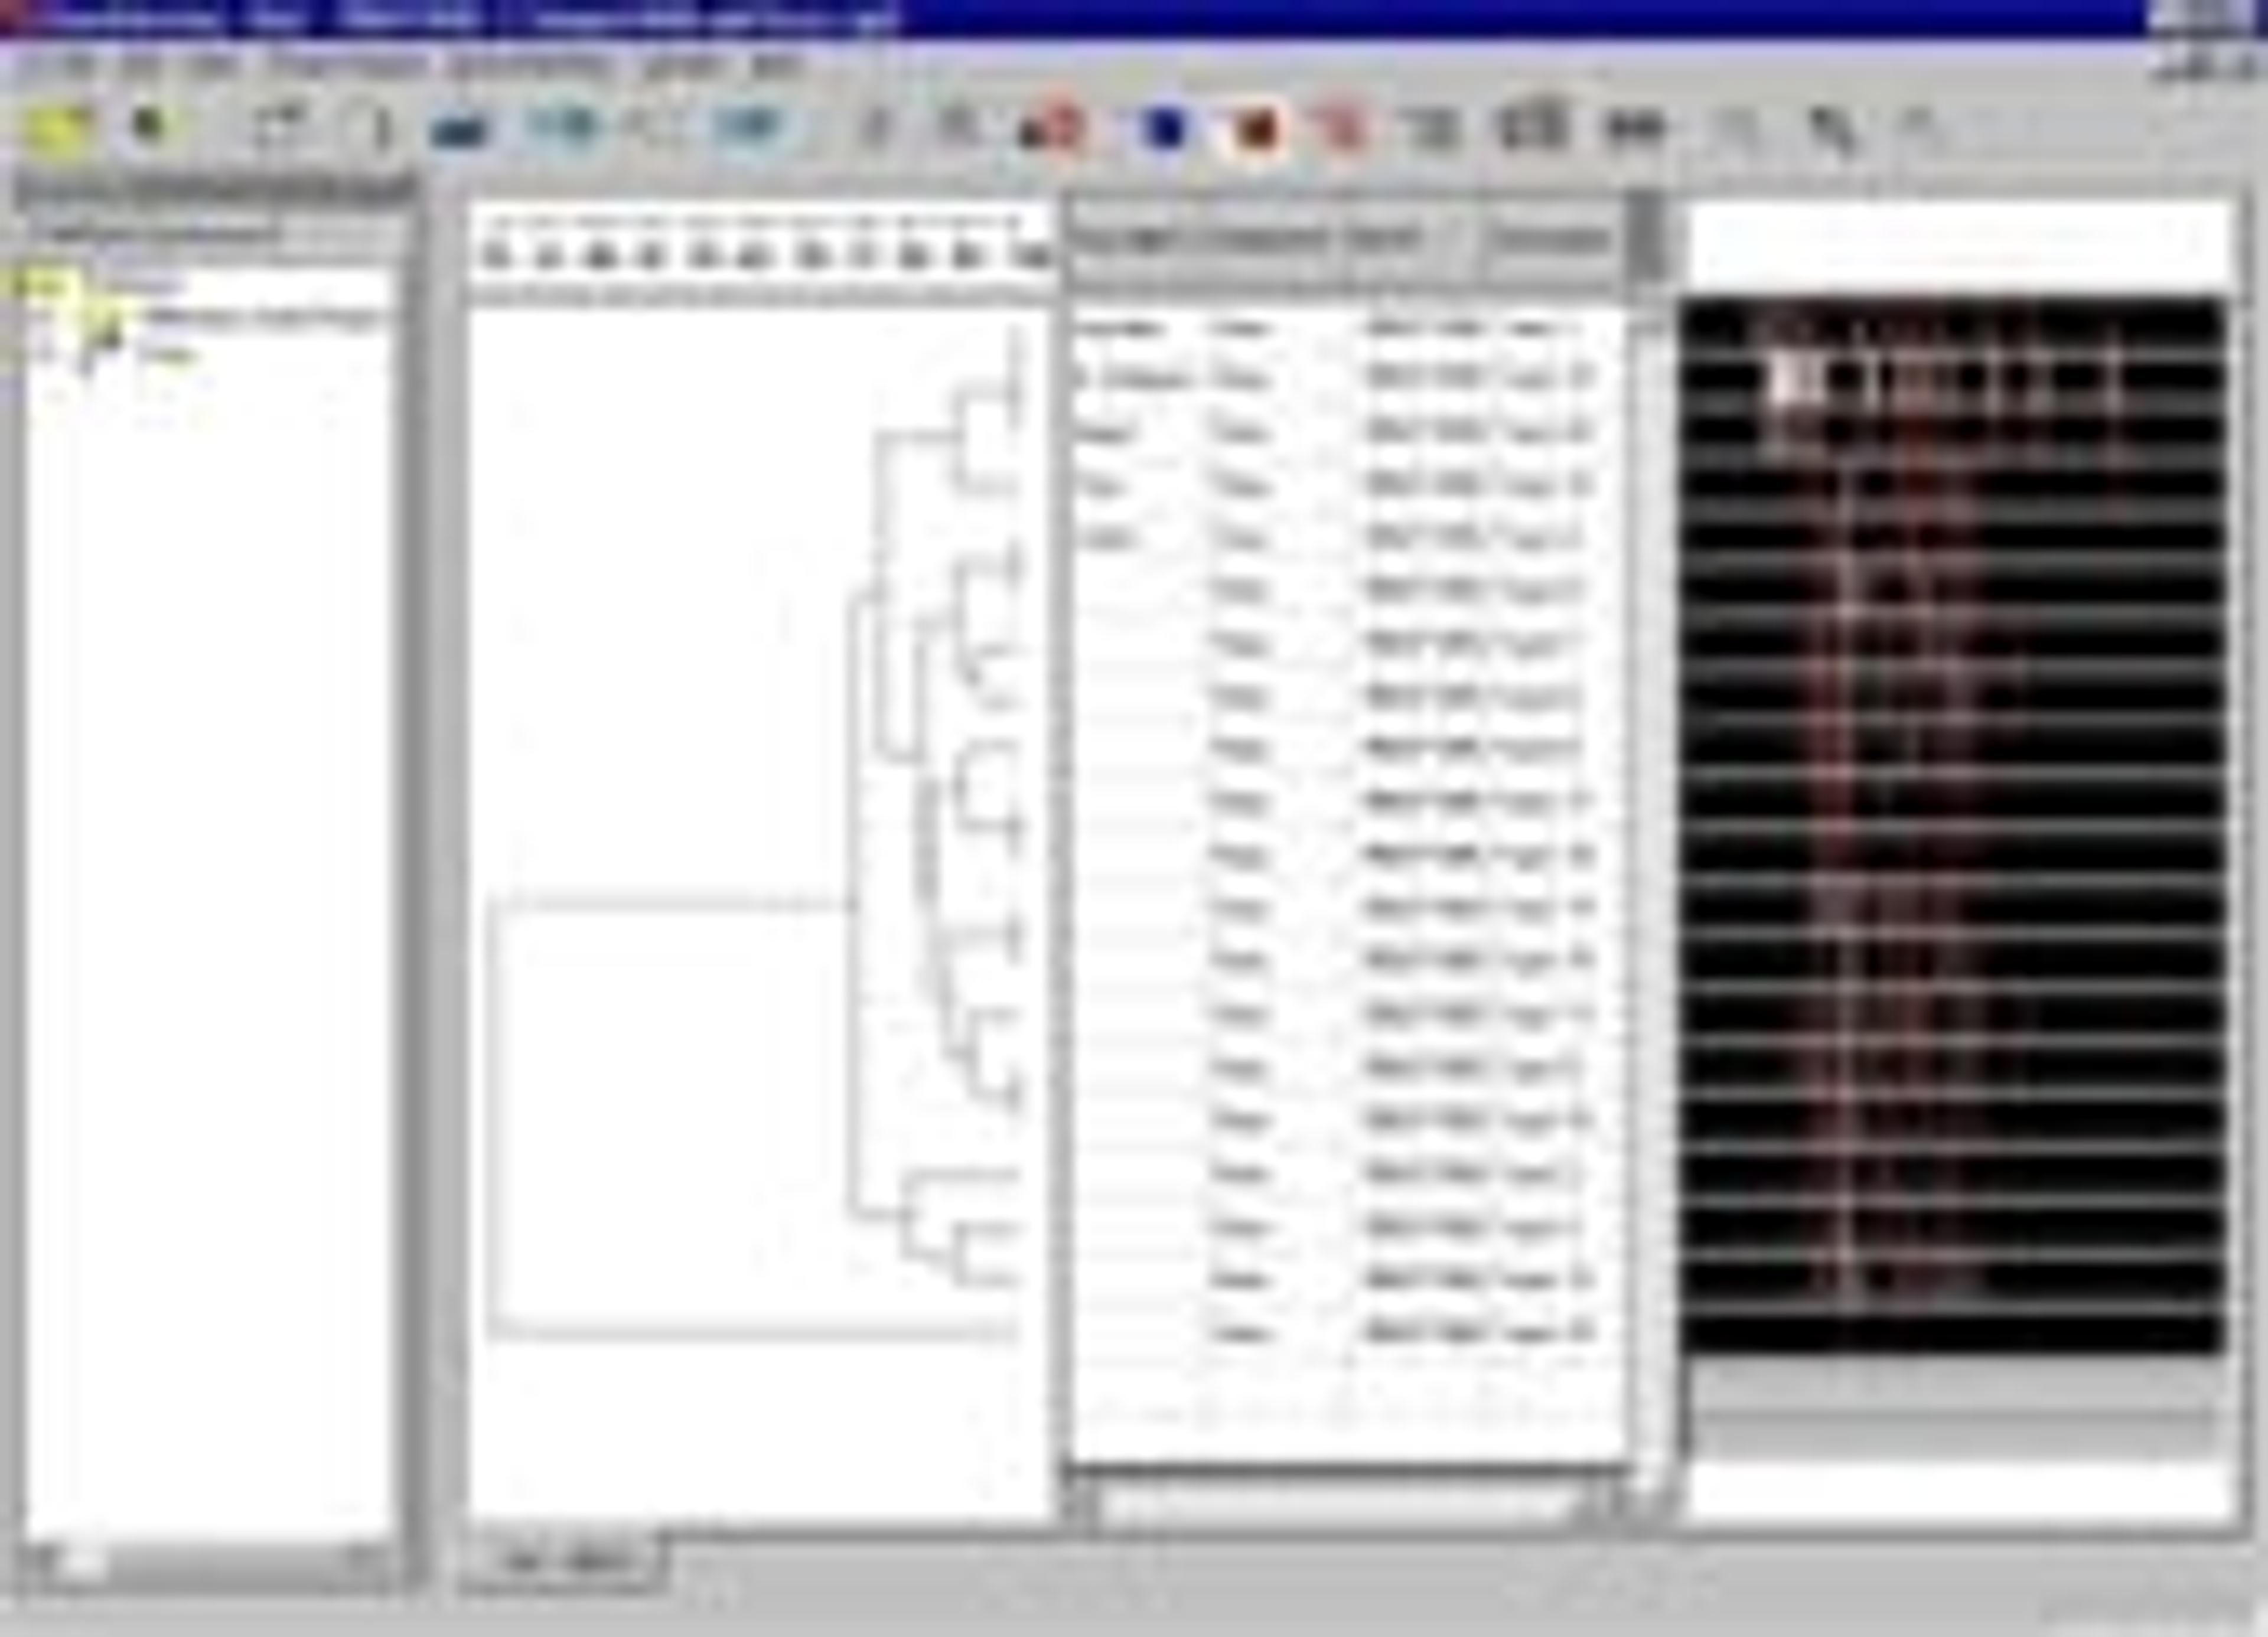
GeneDirectory
SyngeneBand pattern analysis database GeneDirectory is a fast data storage and retrieval system designed for large-scale genomic fingerprinting studies, cluster analysis, VNTR analysis, genotyping and RFLP. Used in conjunction with the GeneTools gel analysis package, this combination is the most powerful and user-friendly comparison tool available today, saving you hours of repetitive work by automatically comparing thousands of bands on different gels. Compiled using the latest databasing technology, GeneDirectory benefits from a very powerful database structure. This gives the user complete control over data stored and retrieved. Other packages which claim to be able to perform gel comparisons or track databasing often have limited function database structures, lacking much of the versatility found in GeneDirectory.
GeneTools
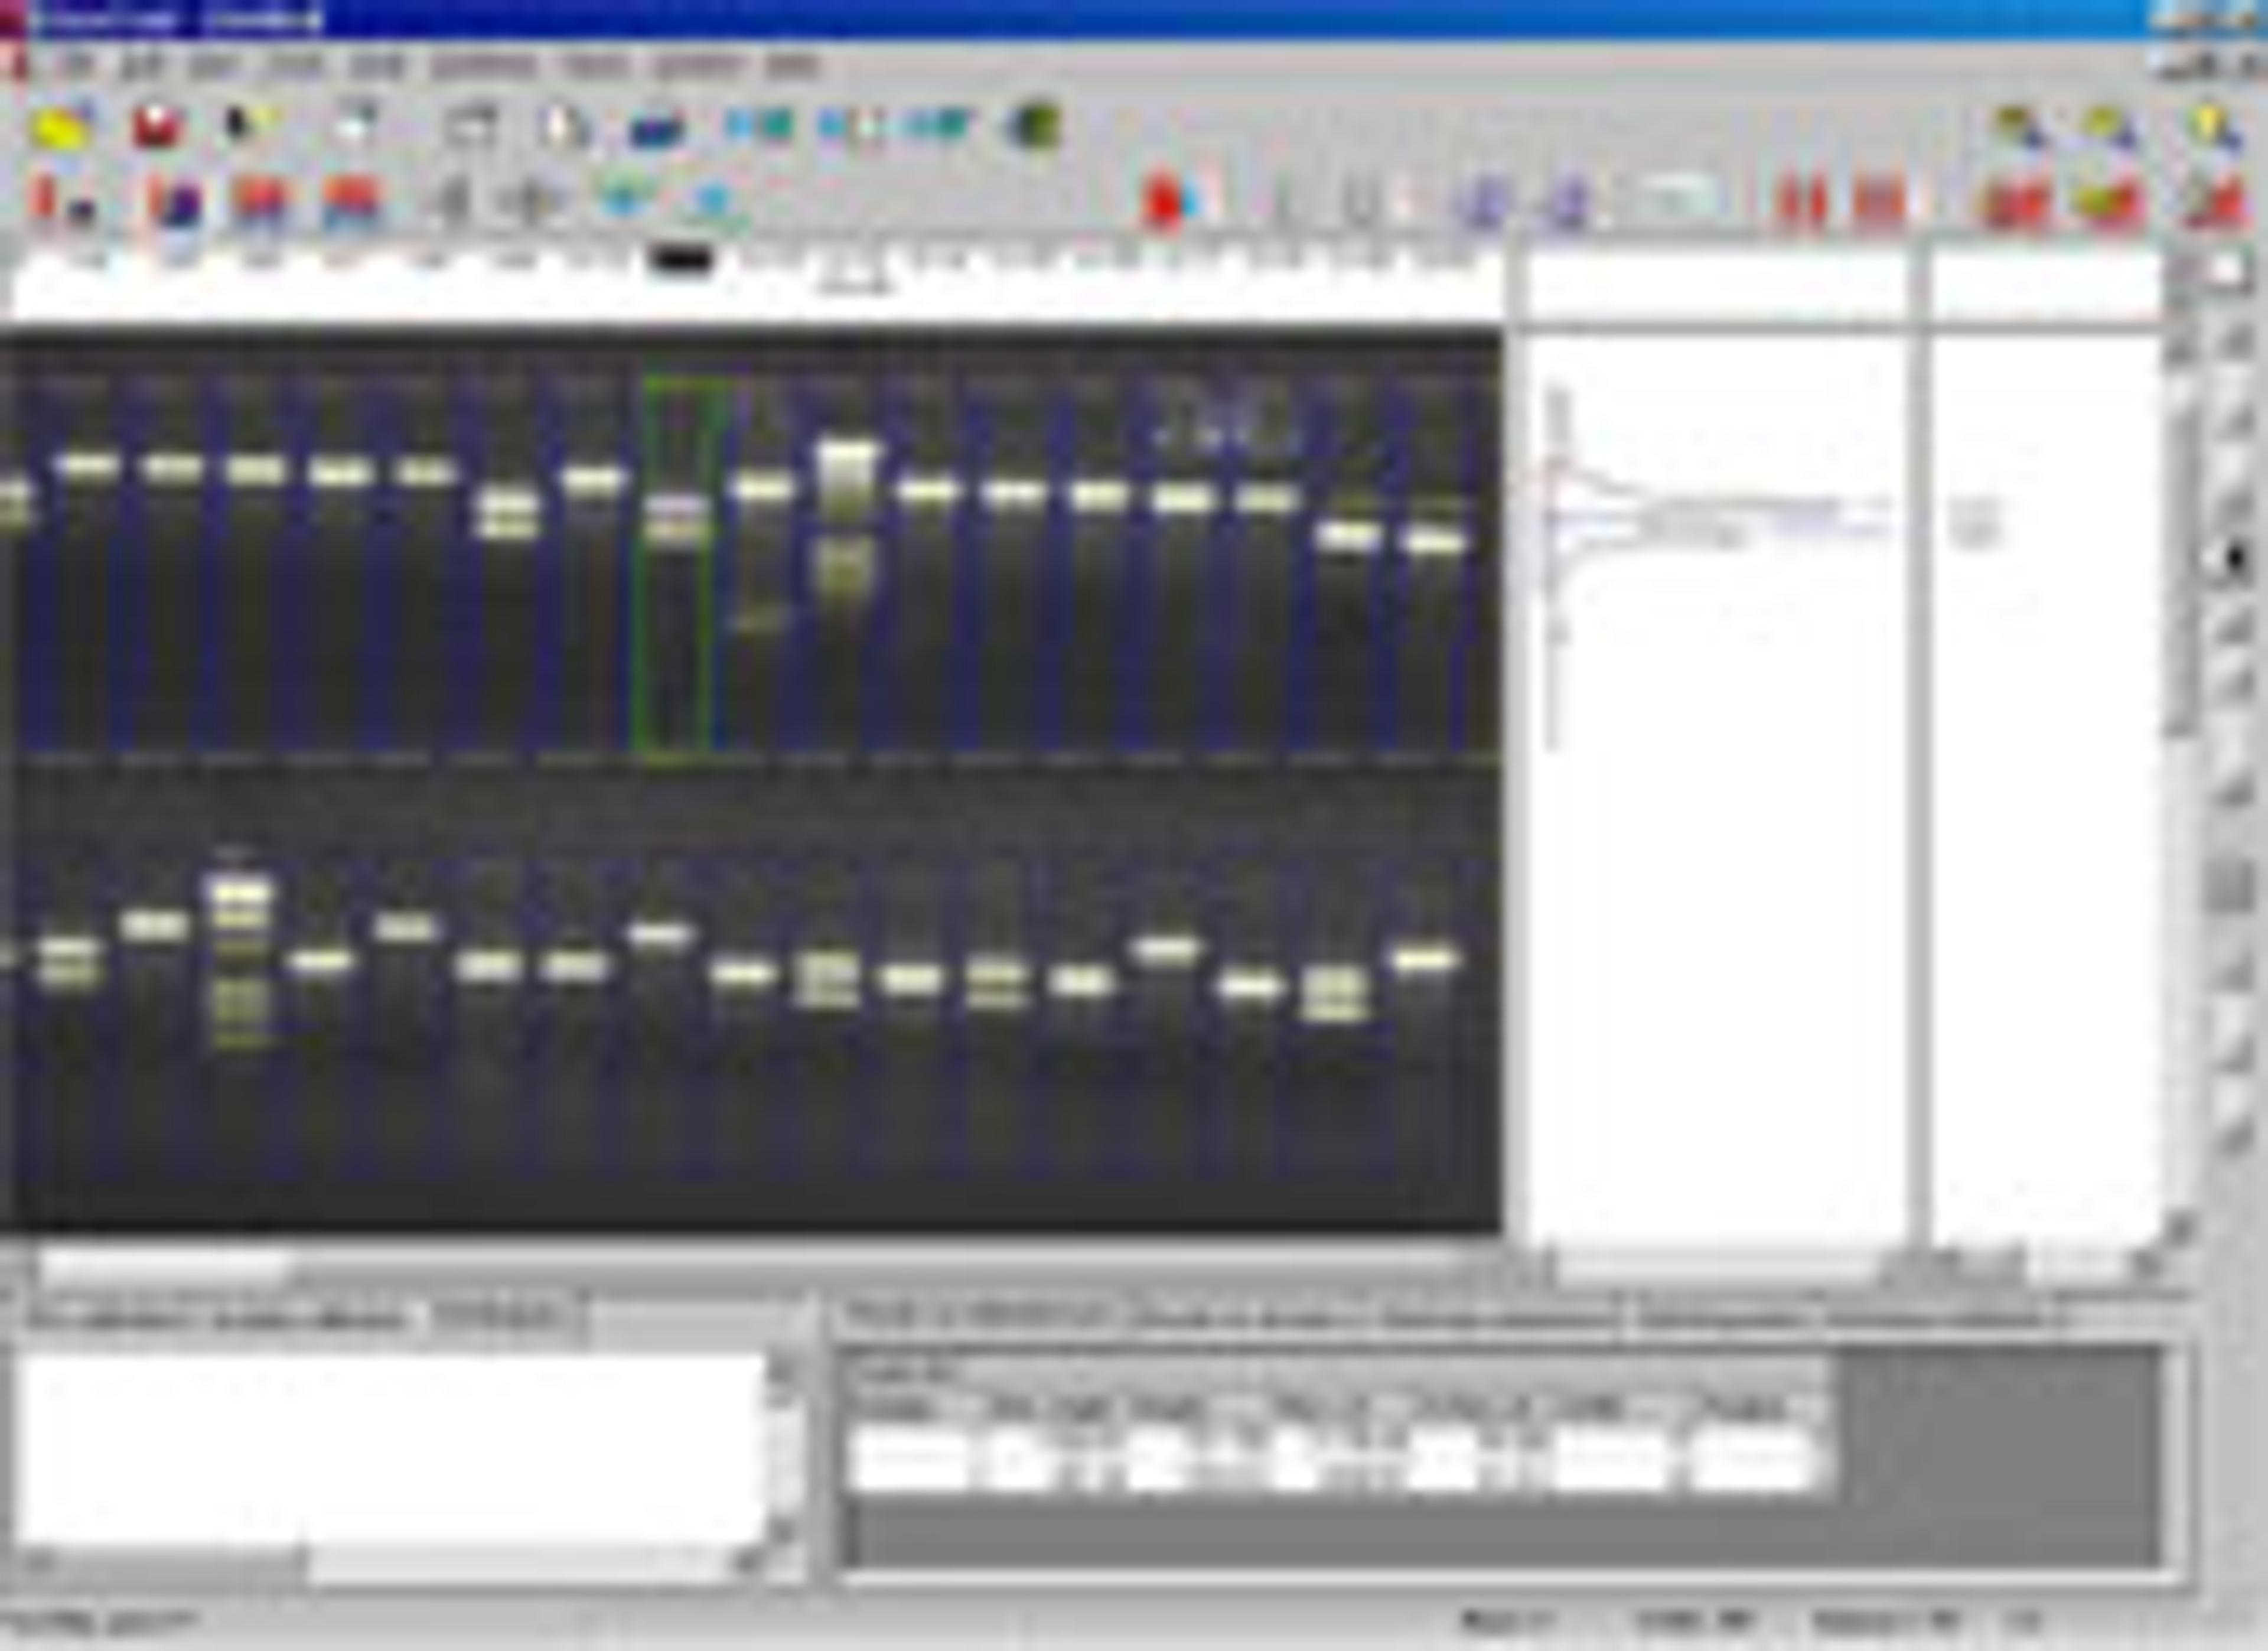
SyngeneSyngene GeneTools - Advanced 1D gel analysis Syngene GeneTools is an advanced 1D gel and 2D spot blot analysis software for use with any gel documentation system. The Syngene GeneTools highly automated software can rapidly analyse a gel from loading an image to output of results in a matter of seconds. With an extensive and flexible array of options you can handle a range of media including gels, plates, films and blots, making Syngene GeneTools one of the most versatile packages of its type. For speed, accuracy and ease of use Syngene GeneTools is a must for any gel documentation system. All Syngene systems come complete with GeneTools. Syngene GeneTools offers you: Automatic lane and band detection with automatic corrections for track distortion and "smiling" bands Automatic analysis of multi-tier gels Wide choice of background subtraction methods Extensive calibration options (Rf, MW, BP and mass) with standards library High throughput screening analysis functions Band matching for lane relationship comparisons with dendrogram generation Extensive results output including to Word and Excel Track profile comparison Integral image browser Adherence to Good Laboratory Practice at every stage including reporting Macros to speed analysis