Free interactive harvest map from Felix Instruments
9 Oct 2017
Felix Instruments-Applied Food Science is proud to introduce Fruit Maps – the world’s first free interactive harvest map. Partnered with Kerry Walsh at Central Queensland University, Felix Instruments- Applied Food Science is announcing a 2018 availability of the free interactive harvest map for all F-750 Produce Quality Meter.
For years, growers have developed their own ways of determining when it’s time to harvest their crops. From the heavily read Old Farmers Almanac - a prediction-based guide for each year based on equal parts superstition and scientific evidence, to the good old practice of tracking data on a spreadsheet.
A significant grower’s lamentation is knowing the perfect time to pick for peak quality and less waste, without jumping the gun or waiting too long and sacrificing profits. Fortunately for growers, engineers and scientists at Felix Instruments- Applied Food Science, in partnership with Central Queensland University of Australia, teamed up a few years ago to develop the F-750 Produce Quality Meter. This instrument allows growers to non-destructively gauge the maturity of fruit using spectroscopy and commodity-specific models to measure traits like Dry Matter and Total Soluble Solids (brix) Originally developed and designed for mangoes, Central Queensland University and Felix Instruments worked for years building an intricate and accurate mango model that comes pre-loaded on the F-750. However, as many users throughout the produce industry can attest to, the F-750 Produce Quality Meter has a range of starter models for fruits such as avocados, apples, grapes, and cherries. These pre-built models provide a good base for a farmer to start collecting data on this produce and then tailor the model to be a perfect calibration for their own farm.
While the F-750 Produce Quality Meter has been on the market and in use for a few years now, this fall Felix Instruments took the device a step further. They’ve partnered with Kerry Walsh, a professor at Central Queensland University and his research team to utilize the seemingly endless fields of Calypso Mangoes in creating the world’s first FREE fruit maturity app: Fruit Maps. This program will be available to any and all F-750 Produce Quality Meter users, and helps take data generated on the instrument and put it into a visual format that can be accessed easily.
At present, Fruit Maps is in its final development stages and exists as a website with credentials provided to F-750 Produce Quality Meter beta testers. In (very) near the future, Felix Instruments is investing their energy to turning Fruit Maps into a phone app, allowing farmers to see the non-destructive readings from the F-750 in real time as it is collected and gauged by Fruit Maps and the F-750- whether they are at home, on the road, or in the field.
Related products
Request Quote for All Products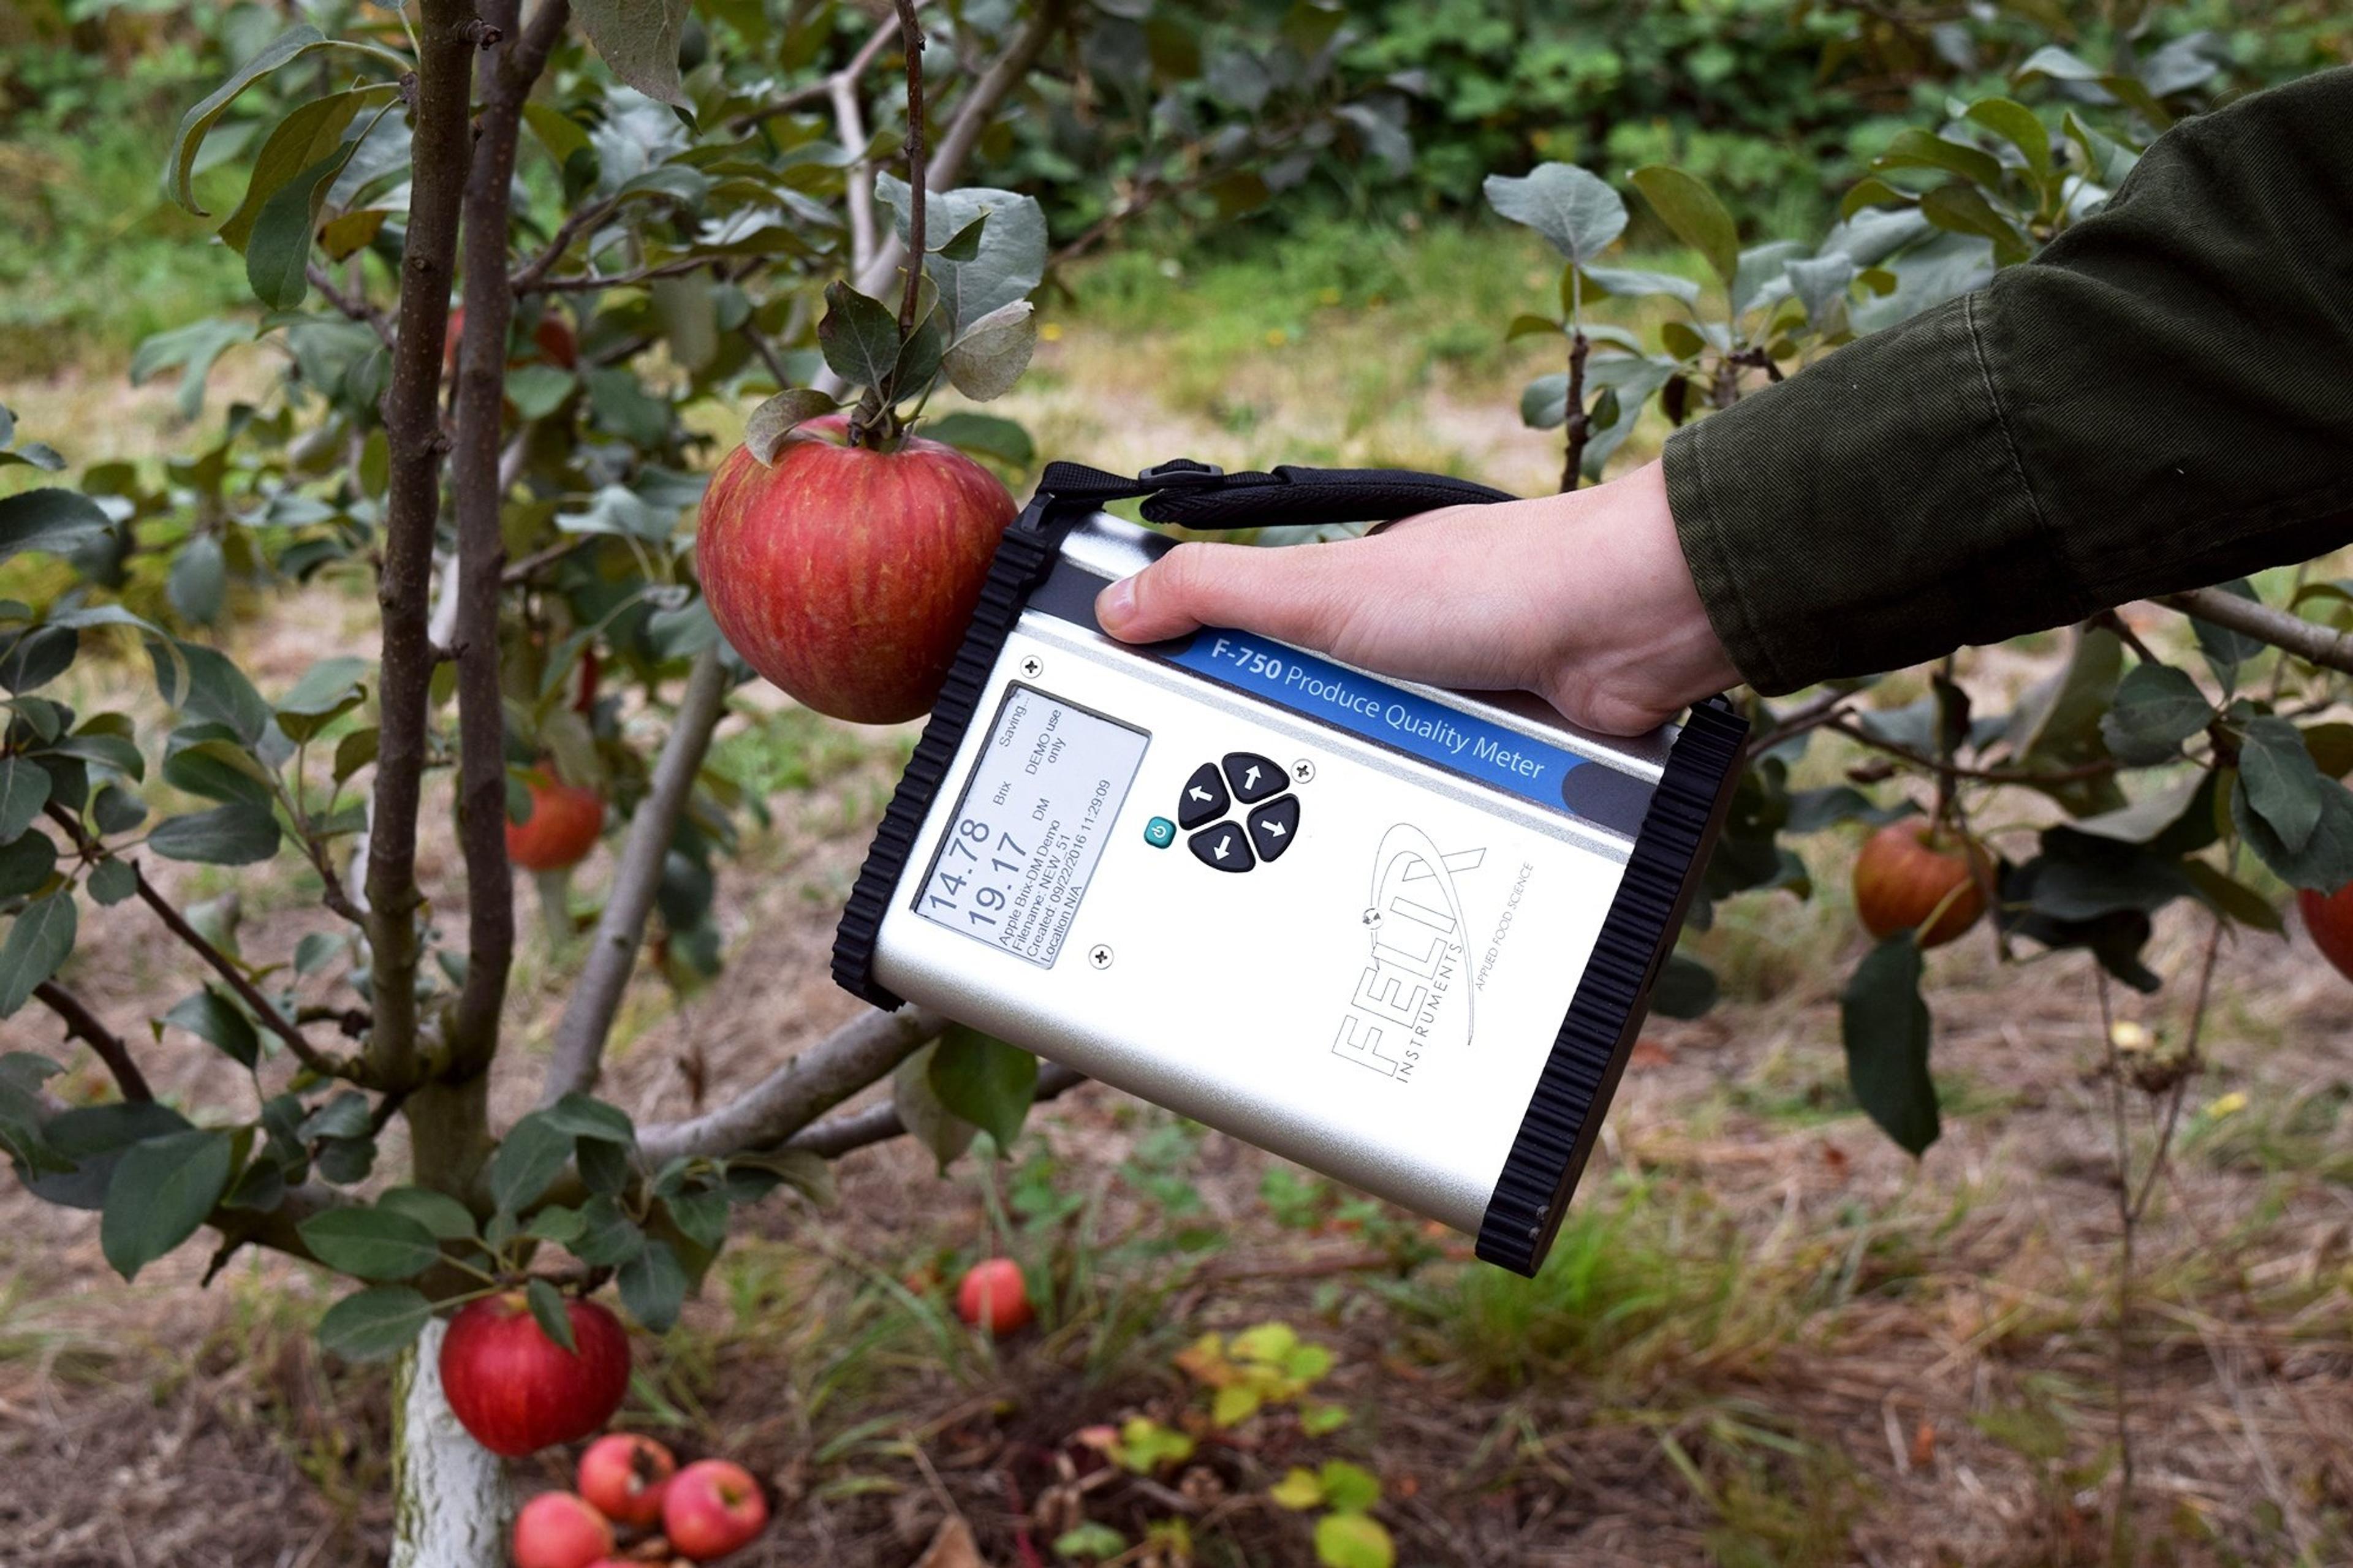
F-750 Produce Quality Meter (from Felix Instruments)
Felix InstrumentsThe F-750 Handheld Brix & Dry Matter Meter uses near-infrared (NIR) spectroscopy to estimate quality metrics such as dry matter, Total Soluble Solids (TSS or brix), titratable acidity, and color.