Refeyn discusses the pros and cons of the top AAV sample characterization methods
13 Jul 2023
Lawrence Howes
Editorial Assistant
AAV sample characterization is a critical step in research, development and manufacturing processes of gene therapies involving these viral vectors (Figure 1). There are several analytical approaches available to assess critical quality attributes (CQAs) for AAV samples, such as capsid content (empty/full ratios) and titer.
Refeyn® discusses the pros and cons of methods including electron microscopy (EM), analytical ultracentrifugation (AUC), charge detection mass spectrometry (CDMS), quantitative polymerase chain reaction (qPCR) combined with enzyme-linked immunosorbent assay (ELISA), size exclusion chromatography combined with multi-angle light scattering (SEC-MALS) and mass photometry.
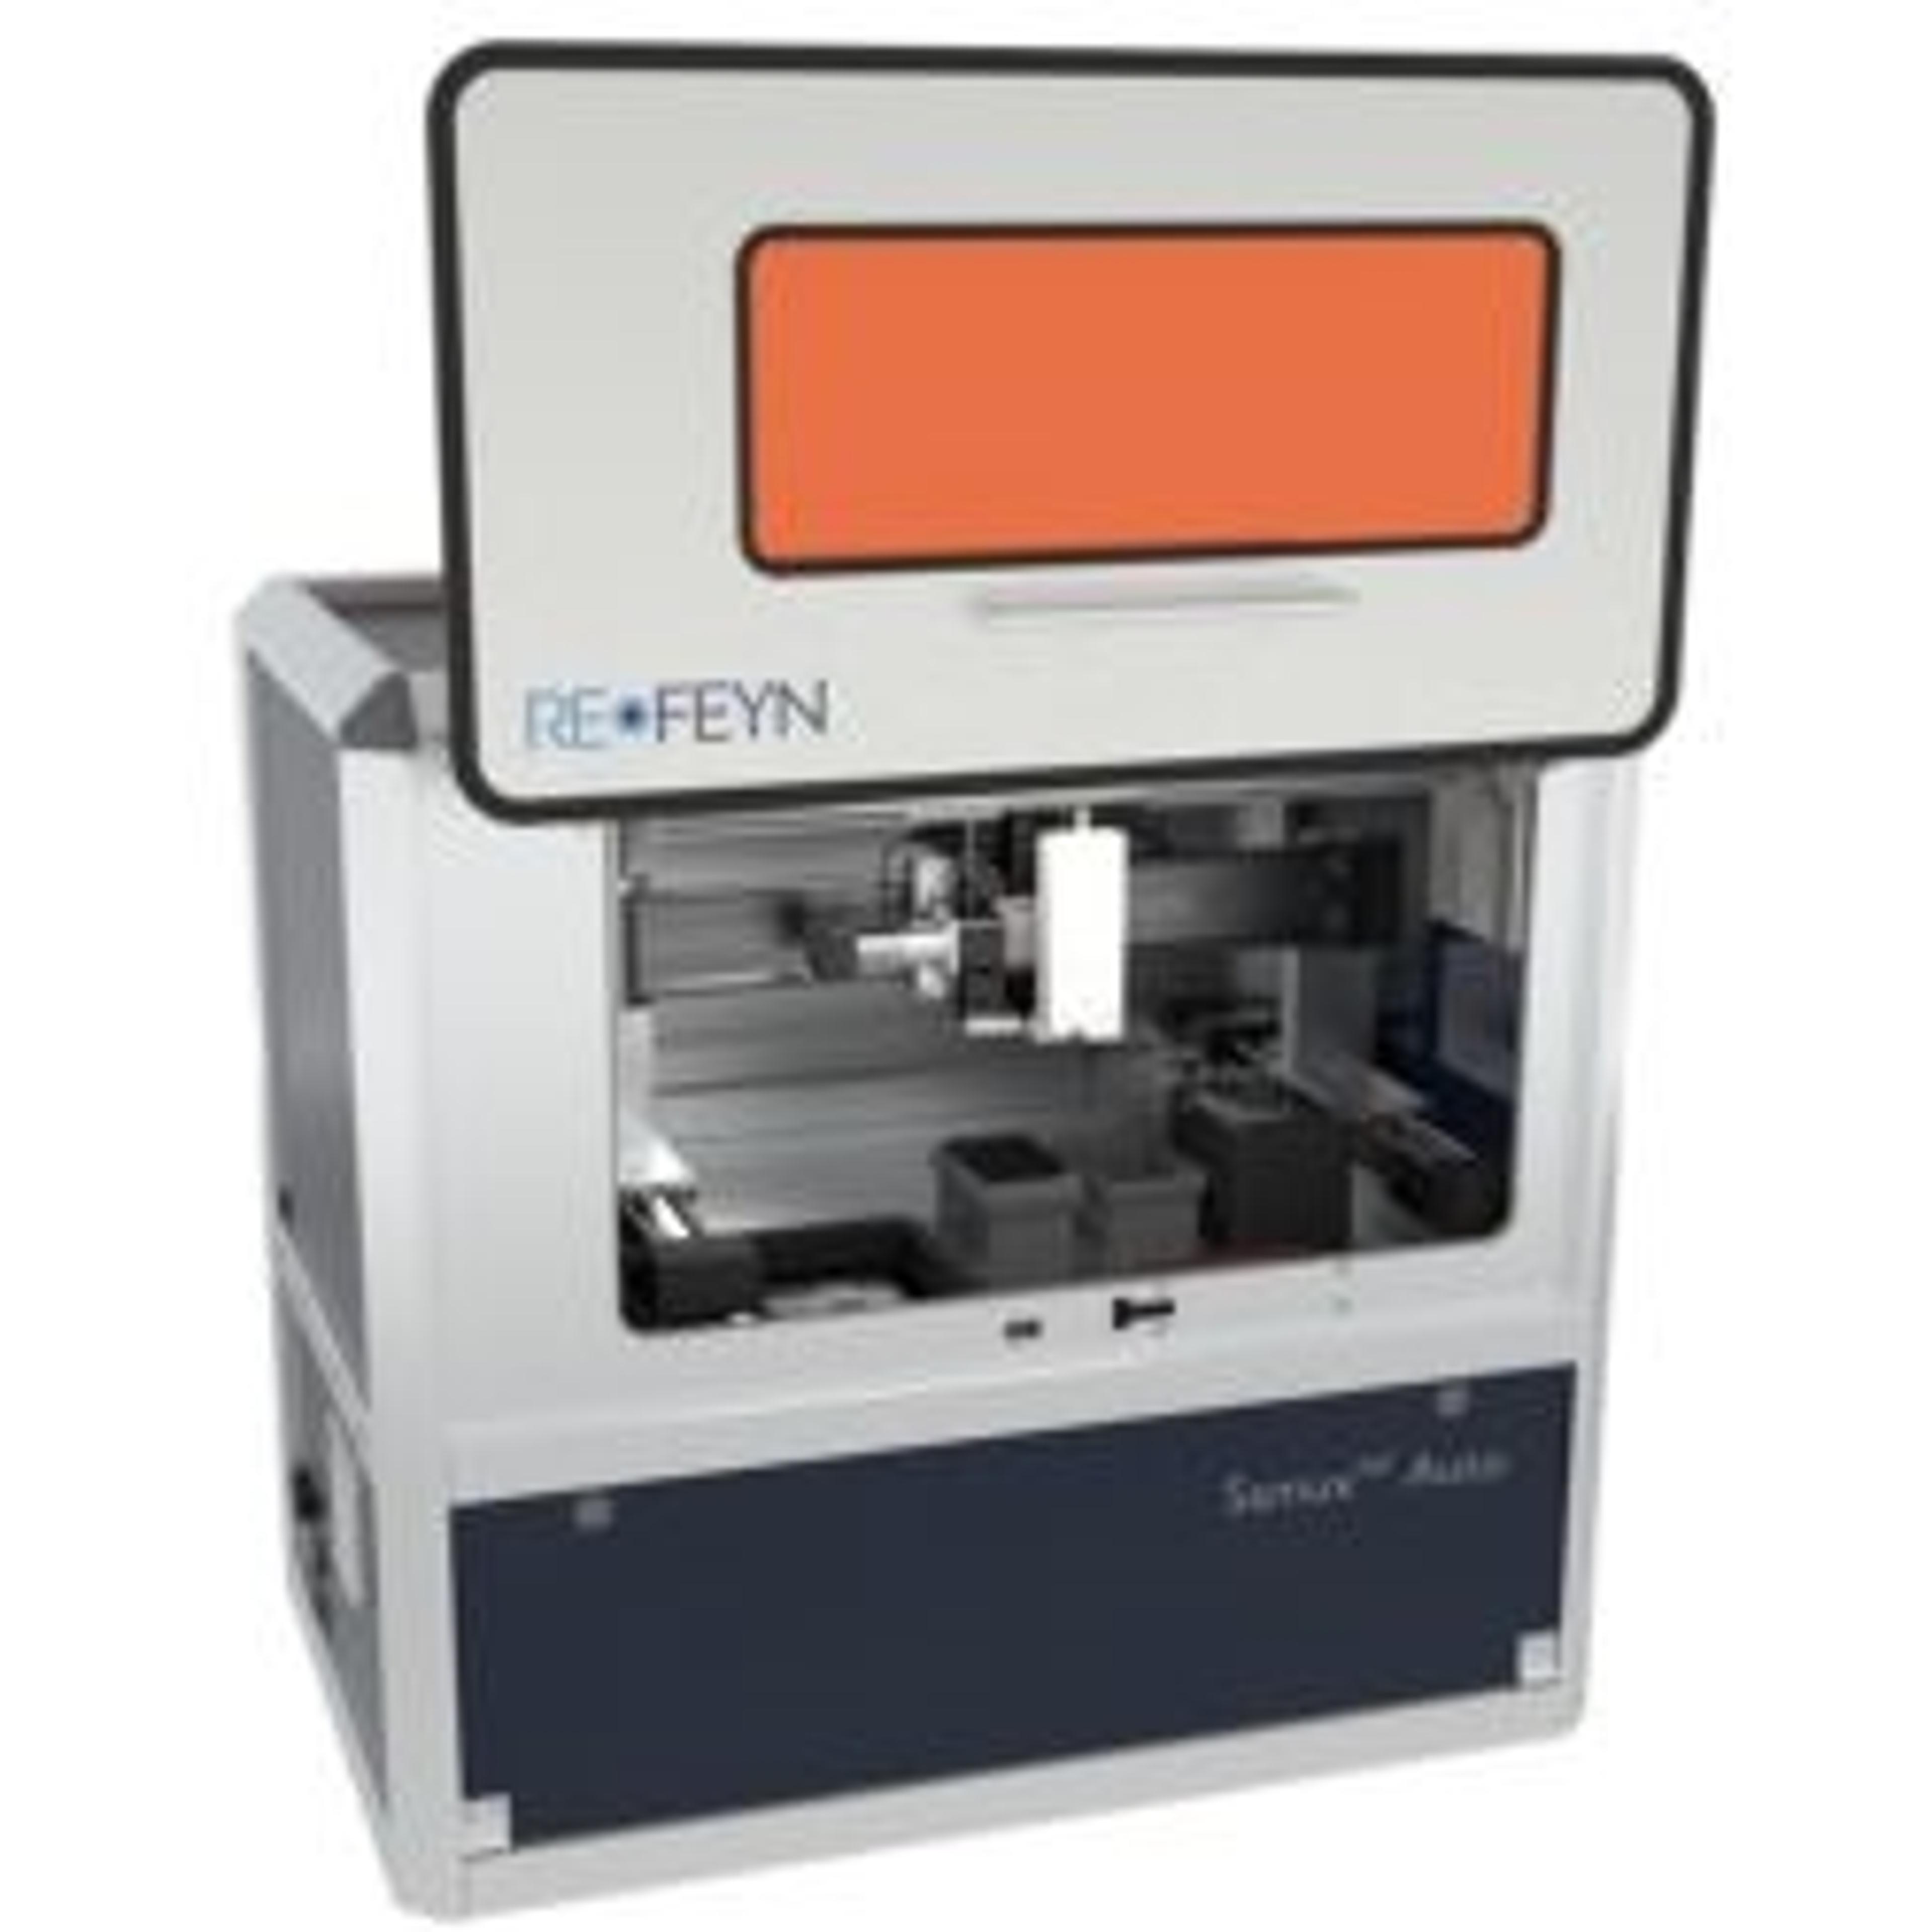
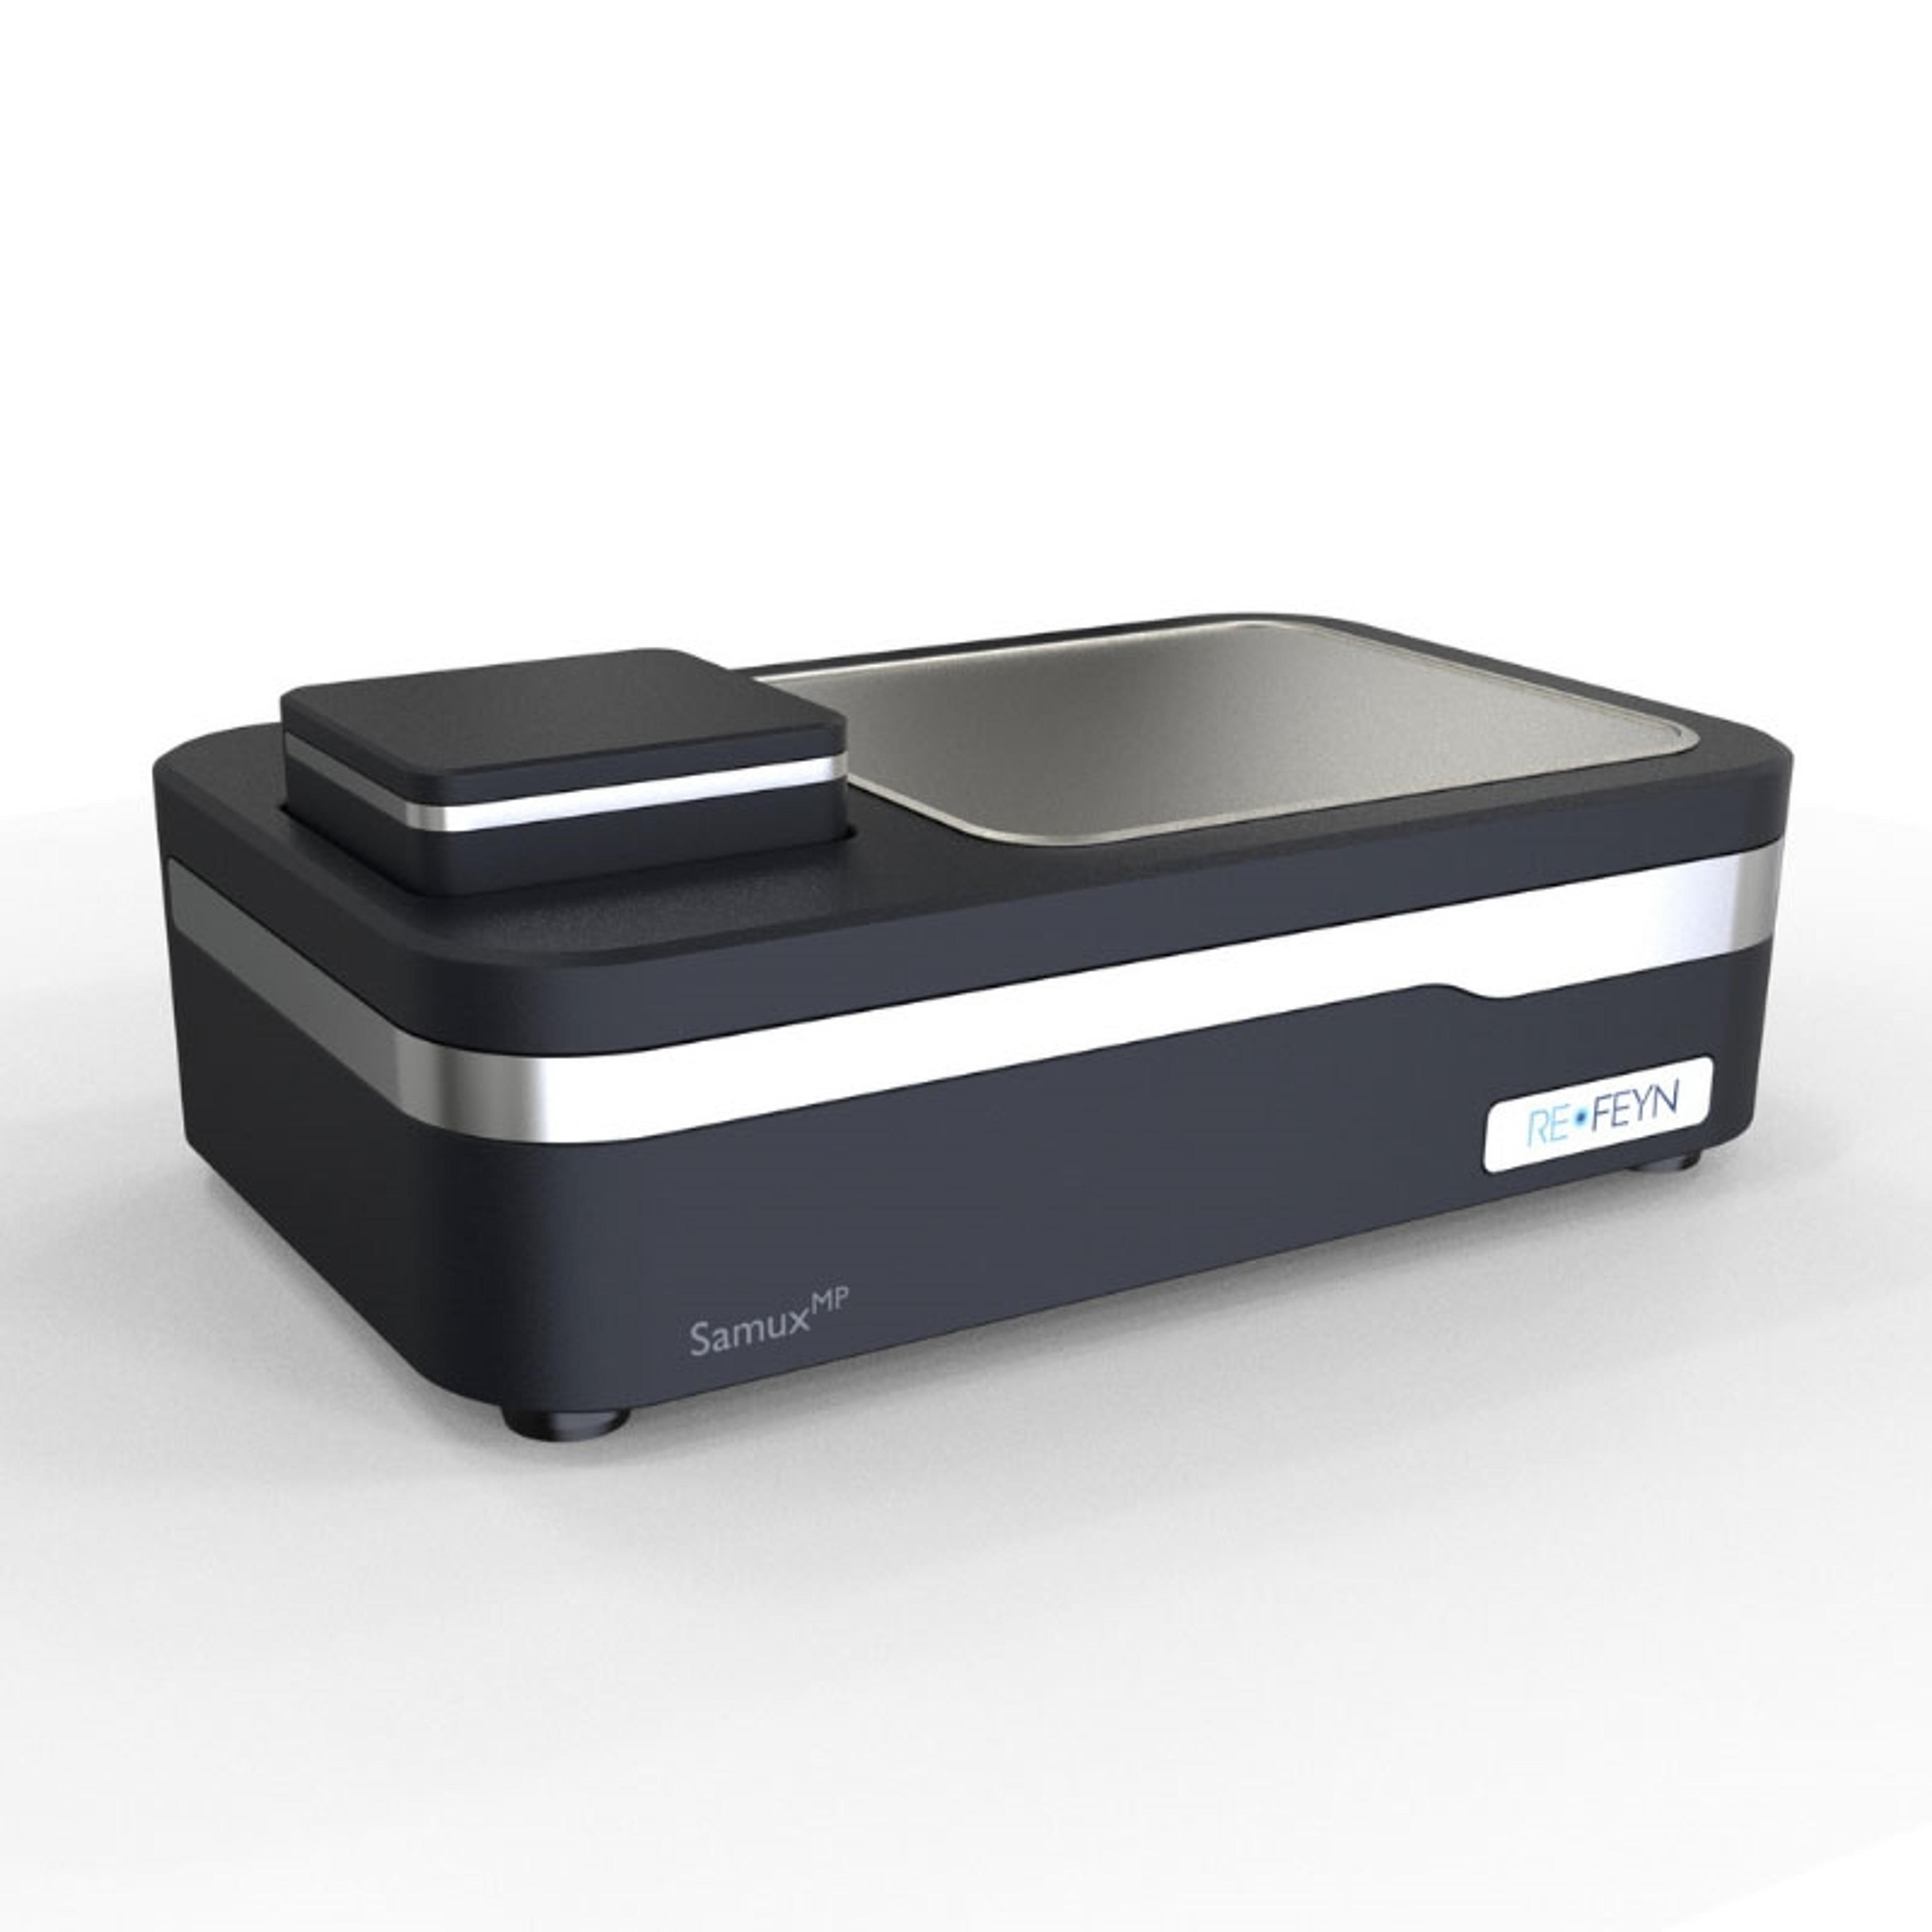
The Samux® line of mass photometry products has been developed specifically for AAV analysis, featuring the SamuxMP and SamuxMP Auto. Refeyn provides a straightforward overview of the key analytical techniques used in the AAV space, so you can understand if and how mass photometry fits into your AAV analytics toolbox, and how it compares to other analytical technologies.
Figure 1. AAV samples can contain a mixture of different species An AAV sample can include a variety of species of lower mass, such as partially assembled capsids, nucleic acids and protein contaminants, as well as fully assembled capsids, which may be empty or loaded with genetic material. How fast do you need to analyze your AAV samples? The sample characterization step can become a bottleneck in AAV development processes. As a result, one practical consideration when choosing between AAV analysis methods is the time each measurement takes. Techniques like qPCR-ELISA, CDMS, EM and AUC are gold standards in AAV analytics, but their relatively long turnaround times can be limiting 1–4. On the other hand, SEC in combination with multi-angle light scattering (MALS), UV and differential refractive index (dRI) detection, are significantly faster. Individual mass photometry measurements take less than five minutes and the automated mass photometer SamuxMP Auto measures 24 samples in an hour autonomously. This makes mass photometry practical to use at any step in development or purification without overly delaying the overall process (Figure 2). Figure 2. Mass photometry provides valuable information throughout downstream AAV purification processes At multiple AAV purification steps (top row), mass photometry could be used to quantify empty and full capsids as well as to detect cellular debris. Do you need frequent, in-house AAV analysis? Equipment, cost and expertise requirements are all important to consider when evaluating the suitability of an AAV analytical method for a given environment. Among the gold standard techniques, both AUC and EM require specialized equipment and highly trained operators to acquire and analyze data. As a result, these techniques frequently need to be outsourced 1–4, 9. As for CDMS, it requires an advanced native mass spectrometer, and considerable expertise for instrument calibration and data analysis. Figure 3. Loading a sample onto a mass photometer Other AAV characterization approaches, such as qPCR-ELISA and SEC-MALS and CDMS, can be run on benchtop instruments, which makes them easier to implement 1–4, 8. Mass photometers fit on a benchtop and require as little as one day of training to operate (Figure 3), placing them solidly within the group of easier-to-implement techniques. Only basic lab skills are required to use mass photometry. An operator simply pipettes the sample onto a sample carrier slide. Do you need to characterize multiple AAV serotypes? If your AAV development and manufacturing processes regularly include multiple capsid serotypes, it is necessary to consider whether that could affect your analytical workflow protocols. AAV characterization methods that depend on high molecular specificity, such as qPCR-ELISA or affinity chromatography, must be optimized for each serotype. On the other hand, techniques that depend on physical parameters, such as hydrodynamic radius or mass, can be applied to different AAV serotypes with no or minimal effort. These serotype-agnostic techniques include SEC-MALS, AUC, EM, CDMS and mass photometry. Do you need to quantify AAV titer? If your viral vector production requires AAV genome and capsid titer quantification, multiple options are available. qPCR-ELISA compares genome titer to capsid titer to determine the empty/full AAV capsid ratios, providing the average titer for each sample analyzed 1, 4, 5. When combined with MALS and UV detection, SEC can be used to quantify AAV titers 1, 4, 8. Some instruments combine static light scattering (SLS) and dynamic light scattering (DLS) with optical density (OD) measurements to calculate AAV capsid titers and empty/full AAV capsid ratios 3. However, not every popular AAV analysis method provides viral titer information; EM, AUC and CDMS, for example, do not provide information on capsid titers. Mass photometry provides a rough estimate of capsid and genome titer. Do you need to detect partially filled and overfilled AAV capsids? In addition to empty and full AAVs, preparations may include capsids that contain genetic contaminants, such as truncated copies of the intended cargo or fragments of host cell DNA. These fragments are often smaller than the intended cargo, so the AAV capsids containing them are only partially filled in comparison to the ‘full’ capsids in the sample. Capsids may also be overfilled – containing more cargo than is intended. To determine whether a sample contains partially filled or overfilled AAV capsids, it is important to choose a technique with enough resolution to differentiate capsids that differ in mass. Bulk analysis techniques such as qPCR-ELISA and SEC-MALS do not have this capability, as they measure average properties across the whole sample. Electron microscopy techniques, on the other hand, struggle to resolve the small electron density differences that would identify heterogeneously loaded capsids 1, 3, 4, 8. In contrast, AUC, CDMS and mass photometry characterize the different species in a sample individually at high resolution, so they can all detect populations of empty, partially filled, full and overfilled capsids (Figure 4)1–4, 6, 8, 9. In terms of accuracy, AUC, SEC-MALS and mass photometry are comparable 6, while CDMS has even greater accuracy9. Figure 4. Mass photometry provides valuable information throughout downstream AAV purification processes The mass histograms obtained clearly showed three distinct peaks, likely corresponding to empty capsids (labeled ‘A’), and two additional peaks of heterogeneously filled capsids (peaks ‘B’ and ‘C’). The three repeats were drawn from the same AAV sample (technical replicates). The measurements were performed on the SamuxMP by Pharmaron's Gene Therapy CDMO. Comparison of common AAV analytical methods Figure 5. Comparison of common AAV analytical methods To optimize your AAV development and production processes, it is important to choose AAV characterization technologies that streamline your analytical workflows. Factors to consider when choosing an approach to analyze AAV samples include measurement time, cost, ease of use, and what information you need on capsid titer and loading. It is fortunate that, as the field of gene therapy develops, we are spoiled for choice with a wide array of analytical technologies available for AAV characterization. In this article, Refeyn have given an overview of the main techniques, comparing them based on their speed, ease of use and analytical capabilities. Overall, Refeyn believes mass photometry compares favorably to other methods, as it provides accuracy and versatility with low time, sample, and expertise requirements. References Penaud-Budloo, M., François, A., Clément, N., and Ayuso, E. ‘Pharmacology of Recombinant Adeno-associated Virus Production’, Molecular Therapy - Methods & Clinical Development, vol. 8, pp. 166–180, Mar. 2018, doi: 10.1016/j.omtm.2018.01.002. Grieger, J.C., Choi, V.W., and Samulski, R.J. ‘Production and characterization of adeno-associated viral vectors’, Nature Protocols, vol. 1, no. 3, Art. no. 3, Aug. 2006, doi: 10.1038/nprot.2006.207. Gimpel, A.L., et al. ‘Analytical methods for process and product characterization of recombinant adeno-associated virus-based gene therapies’, Molecular Therapy - Methods & Clinical Development, vol. 20, pp. 740–754, Mar. 2021, doi: 10.1016/j.omtm.2021.02.010. Werle, A.K., et al. ‘Comparison of analytical techniques to quantitate the capsid content of adeno-associated viral vectors’, Molecular Therapy - Methods & Clinical Development, vol. 23, pp. 254–262, Dec. 2021, doi: 10.1016/j.omtm.2021.08.009. Wright, J.F. ‘Manufacturing and characterizing AAV-based vectors for use in clinical studies’, Gene Therapy, vol. 15, no. 11, Art. no. 11, Jun. 2008, doi: 10.1038/gt.2008.65. ‘AAV analytics with mass photometry’, Refeyn, Brochure, 2022. [Online]. Available: https://www.refeyn.com/_files/ugd/8a9b7f_369e41654e4c4c778a772fa17657d46e.pdf ‘ Wu, D., Hwang, P., Li T., and Piszczek G. ‘Rapid characterization of adeno-associated virus (AAV) gene therapy vectors by mass photometry’, Gene Therapy, pp. 1–7, Jan. 2022, doi: 10.1038/s41434-021-00311-4. Green, E.A., and Lee, K.H. ‘Analytical methods to characterize recombinant adeno-associated virus vectors and the benefit of standardization and reference materials’, Current Opinion in Biotechnology, vol. 71, pp. 65–76, Oct. 2021, doi: 10.1016/j.copbio.2021.06.025. Ebberink, E.H.T.M., et al. ‘Assessing production variability in empty and filled adeno-associated viruses by single molecule mass analyses’, Molecular Therapy - Methods & Clinical Development, vol. 27, pp. 491–501, Dec. 2022, doi: 10.1016/j.omtm.2022.11.003.
The SamuxMP Auto is the automated mass photometer for AAV characterization, autonomously measuring up to 24 samples in approximately 90 minutes. The instrument rapidly measures AAV empty/full ratios, sample purity, and particle aggregation for any AAV serotype – with high precision and reproducibility.
The Refeyn SamuxMP is a mass photometer optimised for adeno-associated virus (AAV) characterisation and is an essential analytical tool for laboratories working with AAVs. The SamuxMP precisely measures the empty/full capsid ratio for AAVs of any serotype. SamuxMP mass photometry measurements are rapid and require very little sample.