
Improving hematology workflow efficiency through flagging optimization
Learn how site-specific flagging optimization can help hematology labs establish review settings that balance operational efficiency with confidence in patient results
16 Jul 2026
A flagged hematology result does not always tell the whole story. It may point to a specimen that needs closer review, and a smear can confirm whether abnormal cells, immature cells, or platelet-related concerns are present. When the smear shows nothing that requires further action, the question becomes: how often is this happening, and could some reviews be avoided without reducing confidence in the results?
For Beckman Coulter DxH 900 and DxH 690T hematology analyzer users, flagging optimization can help answer that question using site-specific data. Beckman Coulter Diagnostics reviews analyzer output, manual differential results, instrument settings, and hematology SOPs to better understand why certain specimens are being routed for additional evaluation.
The goal is to help technologists focus on specimens most likely to benefit from manual review, while supporting accurate and reliable patient results.
Why some labs may need flagging optimization
Beckman Coulter DxH 900 and DxH 690T users operate in a range of local settings. Patient populations, daily volume, staffing models, and review criteria can vary widely from site to site. The analyzer generates messages based on specimens with suspicious findings, while the laboratory’s SOP determines when a smear is required.
A smear that does not change the final report still takes time to prepare, review, and document. When that happens frequently, it may suggest that the current sensitivity levels or decision rules should be evaluated.
Flagging optimization reviews these patterns alongside instrument data, current settings, hematology SOPs, and manual differential results to determine whether the existing setup fits the site’s needs.
Using instrument data to evaluate flagging sensitivity
The assessment starts with instrument data. For suspect messages such as immature granulocytes, left shift, and variant lymphocytes, the analyzer has three sensitivity levels—high, medium, and low—with high generating the most flagged results. The CSV data file exported from the instrument shows the reported patient result and how the same specimen would have been flagged at each sensitivity level.
Those results are then compared with the manual differential to evaluate whether a different sensitivity setting could be preferred for their lab without missing clinically relevant cells.
Truth table analysis compares analyzer flagging patterns with manual smear review findings, helping determine which sensitivity level may be most appropriate for the site’s patient population and SOP.
Reviewing more than the numbers
The CSV file is only one part of the optimization process. Instrument settings, hematology SOPs, and manual differentials are reviewed before recommendations are made about sensitivity levels or decision rules.
For example, when results are flagged with a giant platelet message, the analysis may look at how often the message appears, what the smears indicate, and how the SOP instructs technologists to respond. Based on those findings, Beckman Coulter can help identify decision rules that optimize manual platelet reviews.
The same approach can be applied to immature granulocyte and left shift messages. By combining analyzer data with manual differential findings, the analysis can show whether the sensitivity level is set too high and may be producing more suspect messages than needed.
Making data review more efficient
The Optimization Tool, used by Beckman Coulter Hematology Technical Product Specialists, helps streamline the analysis. Once CSV files are exported from the instrument, the tool calculates how many specimens would flag at high, medium, and low sensitivity levels.
It can also quantify platelet-related findings, including giant platelet messages, platelet clump message, and other criteria, showing where smear review and technologist time may be reduced to improve workflow efficiency.
Instead of compiling and calculating information manually over several days, the data analysis can be completed in minutes. Manual spot checks are still performed to confirm accuracy, but the overall process becomes faster, more consistent, and easier to review with the laboratory team.
Starting with the lab workflow
Optimization often begins with a customer conversation. A site may report that smears are being triggered frequently, even though they are usually normal after manual review.
The process may also begin with a “day in the lab” evaluation, which follows specimens from tube arrival through results release. The evaluation looks at test volume, number of smears, and the types of manual smear reviews or any other follow-up being performed.
That workflow observation provides important context before instrument data is analyzed. It can identify where unnecessary manual work is occurring and where optimization may improve efficiency.
Protecting patient information during data export
Before analyzer data is exported for review, the CSV file contents are reviewed with the team. The file contains specimen-level information and instrument data, and it may include sample ID and patient age. It does not contain patient names, medical record numbers, or other direct patient identifiers.
The export is performed at the instrument level and is not connected to the laboratory information system or the external internet. When helpful, the content of the exported file can be reviewed with the laboratory team before it is analyzed to confirm what information will be used in the analysis and eliminate any concerns about patient privacy.
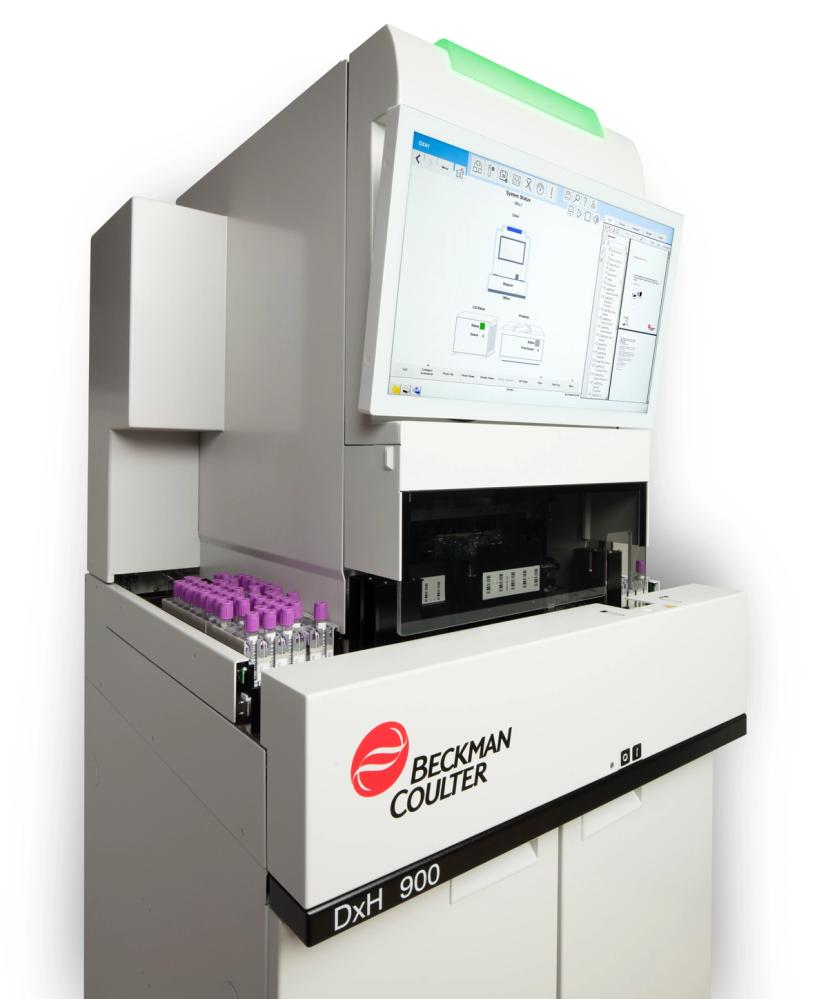
Beckman Coulter DxH 900 hematology analyzer shown from the left side with monitor and sample cassettes visible.
Making manual review more intentional
After the analysis is completed, the findings are reviewed with the laboratory team. The optimization analysis report includes current flagging patterns, relevant guidance such as ISLH Consensus Guidelines, and possible changes to sensitivity levels or decision rules based on the site’s own data.
Those changes can help direct smear review to the specimens where it adds value. For Beckman Coulter DxH 900 or DxH 690T users, that may mean less time spent reviewing negative smears, fewer consumables used, and faster turnaround time.
It also gives technologists more time to focus on work that requires their judgment and expertise.
With site-specific data, laboratories can better align instrument settings, SOPs, and daily workflow so manual review is focused on the cases where it can make the greatest difference.
Related products
Request Quote for All Products
DxH 690T
Beckman Coulter DiagnosticsThe right results, the first time, in your mid-volume laboratory
Links
Tags
Frequently asked questions
Show frequently asked questions
How does Beckman Coulter DxH 900 and DxH 690T flagging optimization improve hematology smear review efficiency?
Flagging optimization for Beckman Coulter DxH 900 and DxH 690T uses site-specific instrument data, manual differentials, and hematology SOPs to refine suspect message sensitivity. By aligning analyzer settings with the lab’s patient population and workflow, it can reduce unnecessary smears, decrease negative smear reviews, save consumables, and shorten turnaround time while maintaining accurate and reliable patient results.
What role does the Optimization Tool play in evaluating suspect messages like immature granulocytes and giant platelets?
The Optimization Tool, used by Beckman Coulter Hematology Technical Product Specialists, analyzes CSV files exported from DxH 900 and DxH 690T analyzers. It calculates how many specimens would flag at high, medium, and low sensitivity for suspect messages such as immature granulocytes, left shift, and giant platelets. This helps identify where smear reviews and technologist time can be reduced without missing clinically relevant findings.
How does Beckman Coulter Diagnostics protect patient information during hematology flagging optimization?
Before data export from the DxH 900 or DxH 690T, Beckman Coulter Diagnostics reviews CSV contents with the lab team. The file includes specimen-level instrument data, sample ID, and possibly patient age, but excludes names, medical record numbers, and other direct identifiers. Export occurs at the instrument level, not via the LIS or internet, helping safeguard patient privacy during flagging optimization analysis.