Shimadzu Releases ChromSquare V2 Software for GCxGC(MS) Systems
21 May 2014
Shimadzu, one of the world leaders in analytical instrumentation, has released the ChromSquare V2 software for GCxGC(MS) systems.
ChromSquare V2 provides easier and more reliable data analysis from GCxGC(MS) analysis, enabling all operations from qualitative to quantitative analysis. This software was introduced at the 38th ISCC (International Symposium on Capillary Chromatography), held at Riva del Garda in Italy.
ChromSquare V2 results from cooperative research with a group headed by Professor Luigi Mondello at the University of Messina (Italy). This group implements cutting-edge research in the field of comprehensive 2D chromatography.
Background to the development
GCxGC(MS) analysis is a technique allowing connection in series of two columns with different separation characteristics which enables the separation of target substances even for complicated samples containing hundreds of components. It is applied in fields such as foods, flavorings, environment and chemistry. GCxGC(MS) analysis is also used to analyze natural substances containing many impurities which are impossible to analyze with normal 1D GC or GC-MS methods, and for separating trace components hidden by main components. Quantities of 2D data obtained from GCxGC(MS) analysis and data from mass spectrometers used as detector are extremely large. They cannot be analyzed with a normal workstation and need complicated handling and exporting procedures.
Perfect software for easy data handling
ChromSquare V2 simplifies the GCxGC(MS) analysis process with complicated matrices. It provides a higher operability and data visibility, while enabling easy performing of quantitative analysis. In addition, it runs cooperatively with Shimadzu’s GC-MS software. As a result, this is the optimal product for customers who want to perform analyses with the same operating methods as conventional GC and GC-MS software, and for customers who want to perform both qualitative and quantitative analyses.
High data visibility and linkage with GCMSsolution
ChromSquare V2 can display a 2D map with boiling point and polarity as the axes, and a raw chromatogram and spectrum that are sources of the map, as well as a table summarizing information on peaks detected in the 2D map, all in a single window. This simplifies data analysis. In addition, it allows data from Shimadzu’s GCMSsolution (GC-MS software) to be imported directly, and enables searching of database information.
Easy calibration curve creation and quantitative analysis
By simply switching between the three panels, the user can perform all necessary operations from qualitative analysis to creation of calibration curves and quantitative analysis. This software enables general GC-MS users to achieve easy data handling of a wealth of information with its intuitive operability.
Related Products
Request Quote for All Products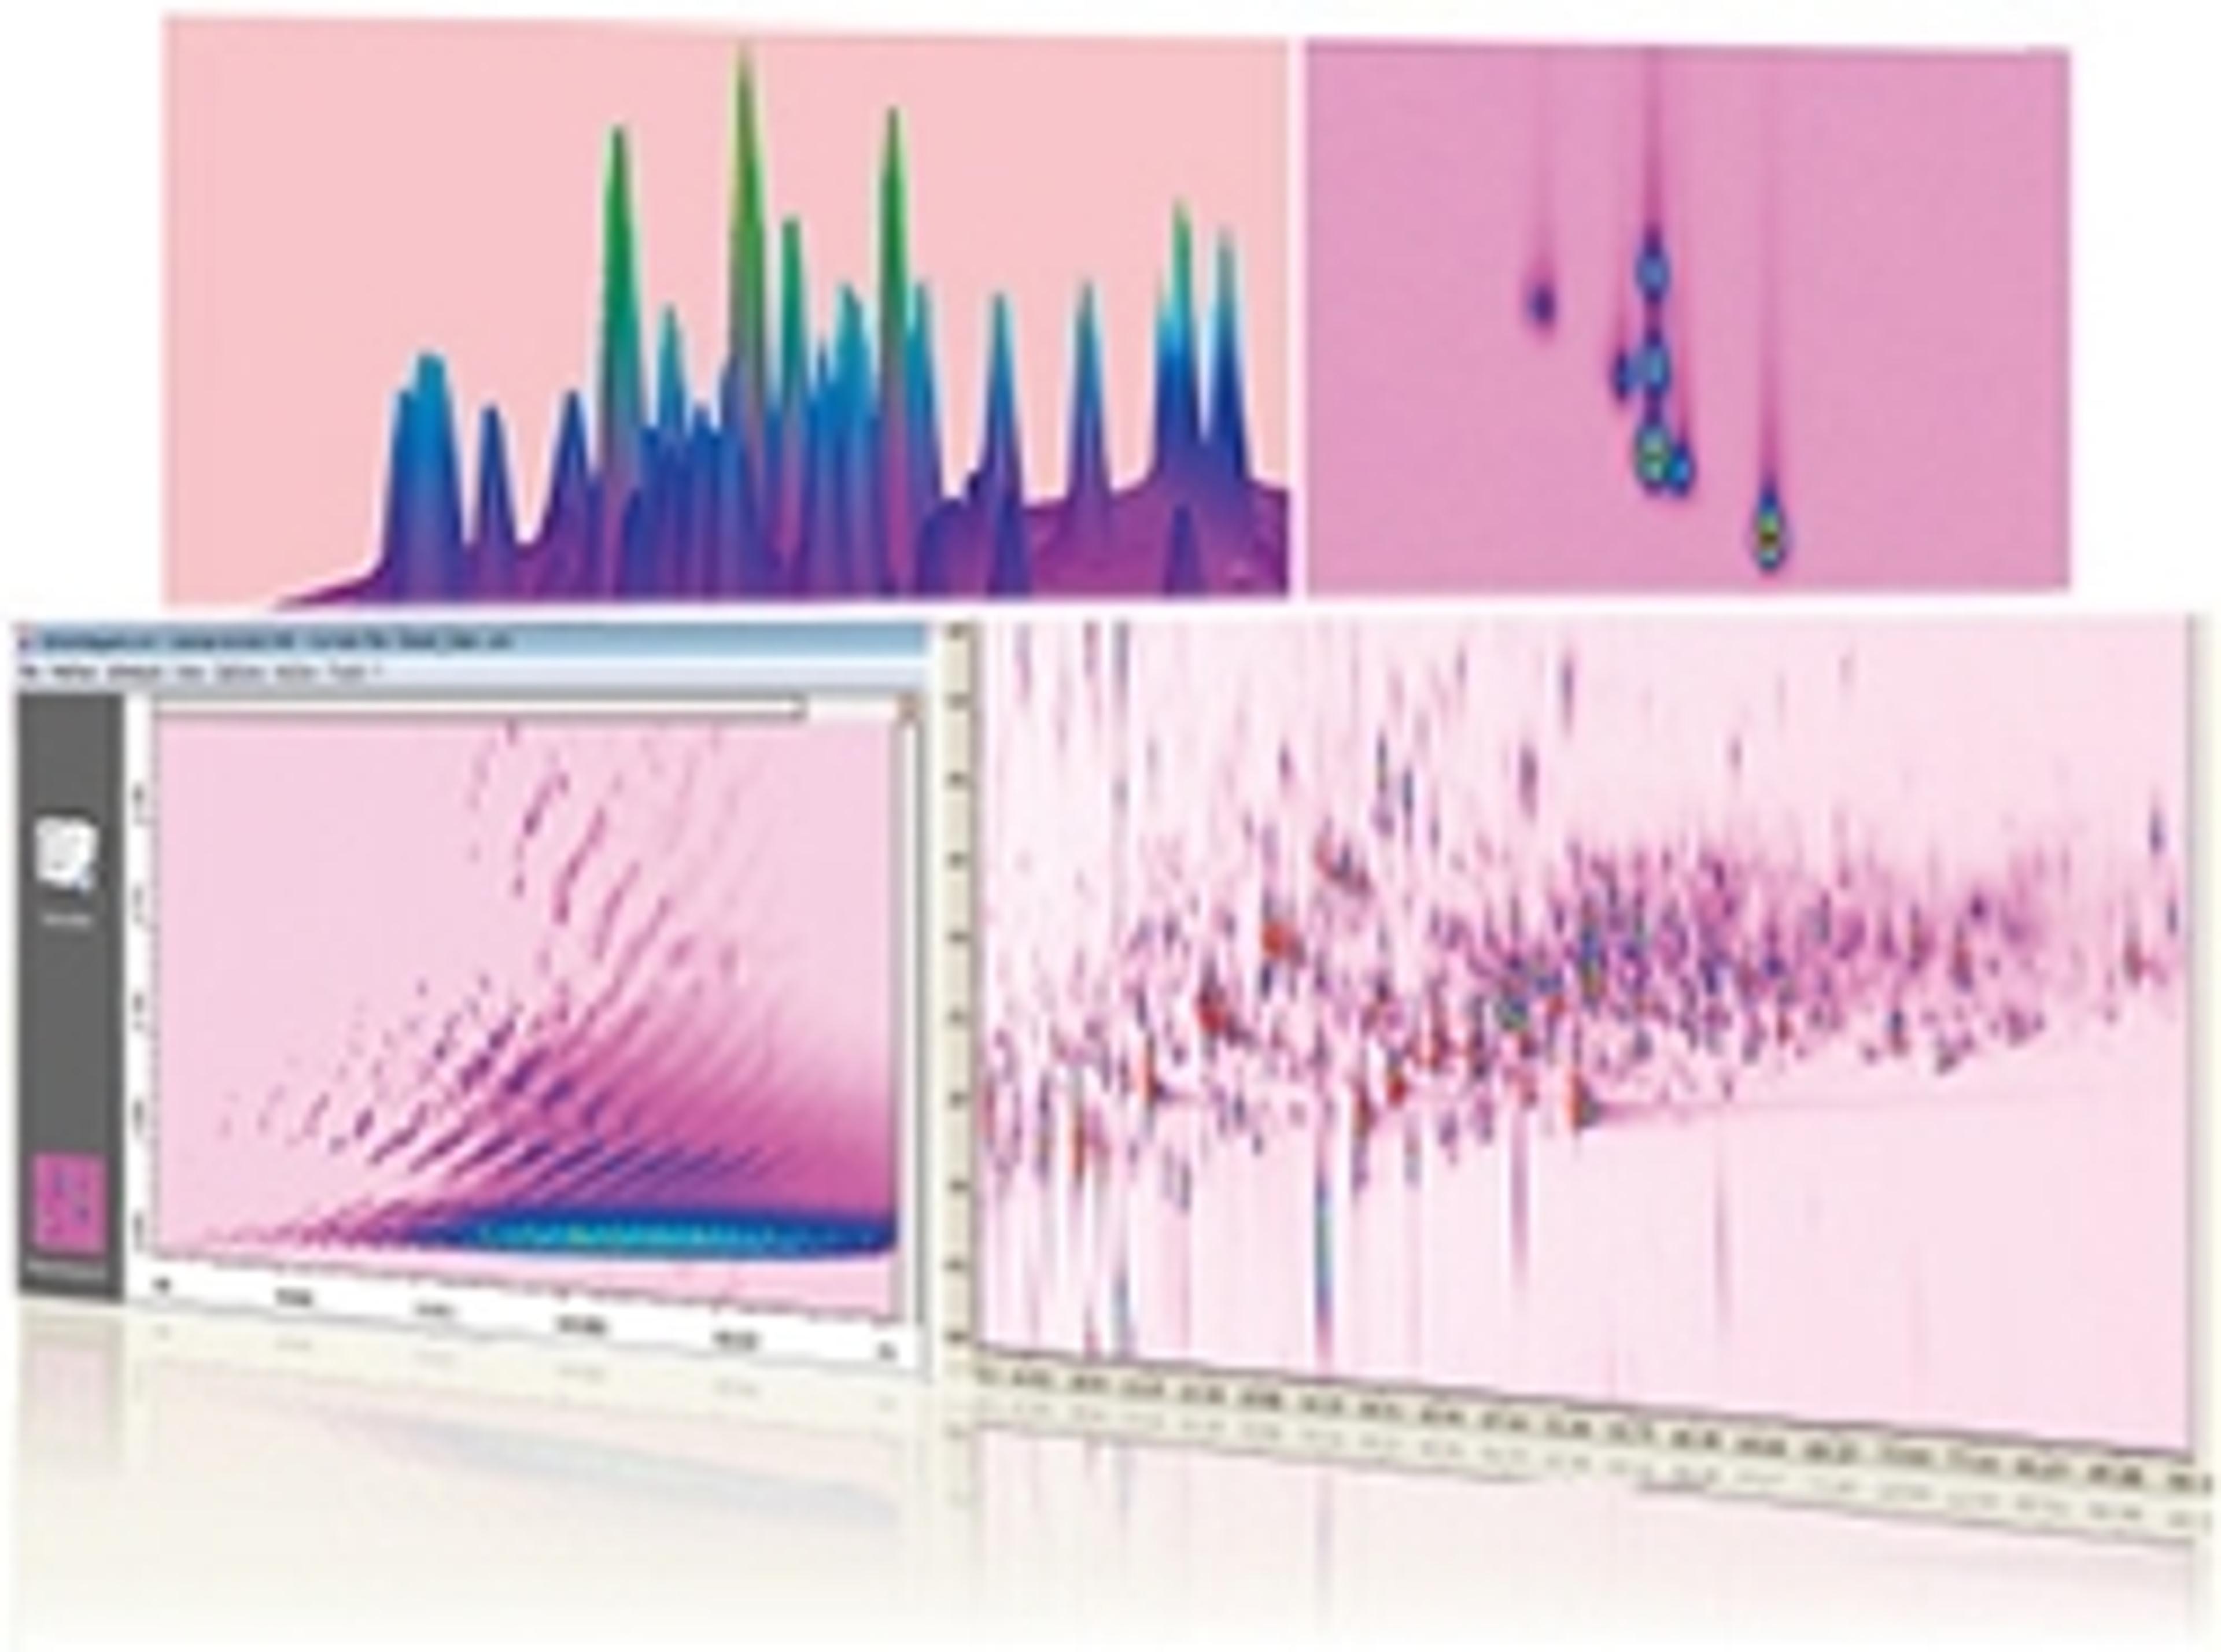
ChromSquare V2 Software
ChromSquare GC/GC is data analysis software for comprehensive gas chromatography (GC/GC). GC/GC analysis uses two different types of columns for higher resolution. This makes it possible to analyze samples with a large number of components that are difficult to identify using regular GC or GC/MS systems, due to overlapping peaks. ChromSquare software enables qualitative and quantitative analysis in a single window. Moreover, the software utilizes MS spectral information to improve the accuracy of data analysis.Furthermore, in addition to being able to load Shimadzu GCMS data, it employs the popular GCMSsolution engine for MS spectral searching, which is especially important for qualitative analysis. This results in easier and more accurate data analysis.Features: Modulation time and spectra are used to decide whether a peak belongs to a certain spot. Displays peaks in the corresponding one-dimensional chromatogram using the same color as the spot boundary in the 2D map. Moving the cursor across the 2D map displays the corresponding location on the one-dimensional chromatogram and displays the mass spectrum corresponding to that position. Shows the relationship between the 2D map and spot table highlighted. Simply switch between the three panels displayed in the same window (Schedule, Chromatogram, and Method) to perform qualitative analysis, prepare calibration curves, or even perform quantitative analysis. Identify spots from multiple sets of data for quantitative analysis using retention times or mass spectra similarity filtering.