Thermo Fisher Scientific Launches Expanded and Improved Ultradry Silicon Drift Detector for Noran System
17 Sept 2012Product news
Thermo Fisher Scientific Inc., the world leader in serving science, is featuring its new Thermo Scientific UltraDry silicon drift X-ray detector at EMC 2012 from 16th to 21st September 2012 in Manchester, UK. The new detector is a best-in-class instrument offering faster, more accurate interpretation of X-rays for industries such as metals and mining, advanced materials and semiconductors. It further improves the performance of the widely acclaimed Thermo Scientific NORAN System 7 X-ray Microanalysis System. SelectScience stopped by Thermo Scientific Booth 305 at EMC to find out more.
“Our UltraDry silicon drift detector provides superior resolution at the incredibly high collection rates critical in today’s nano technology and advanced materials applications,” said John Sos, vice president and general manager for Thermo Fisher’s molecular spectroscopy and microanalysis products. “Our enhancements to this detector in turn allow our entire NORAN System 7 to deliver more data faster. Using our exclusive data-processing tools, COMPASS and Direct-to-Phase software, users can raise their confidence in EDS results to new levels.”
The UltraDry silicon drift detector performance enhancements are a direct result of its design and technology improvements. Pushing the limits of energy resolution, the UltraDry detector achieves a spectral resolution of 123 eV at Mn-Kα. Reducing the size of the advanced field-effect transistor (FET) and integrating it directly into the device’s crystal structure virtually eliminates device capacitance that leads to electronic noise. The UltraDry detector effectively handles pulse pile-up, minimizes dead time and maximizes resolution on the fly. The result is an extremely high data collection rate with no external or liquid nitrogen cooling and virtually no sacrifice in energy resolution.
The new UltraDry detector offers an expanded range of crystal active areas (10 mm2, 30 mm2, 60 mm2 and 100 mm2) as well as advanced window technology and unique algorithms that provide full light element analysis down to Beryllium. Other key features include:
• Custom engineering to minimize the sample-to-detector distance and maximize the detector’s solid angle
• Vertically slotted collimator to enable maximum working distance range
• Operating environment to 35° C
The NORAN System 7 is ideally suited for industries including metals and mining, advanced materials, academic research, semiconductor and microelectronics, failure analysis and defect review.
Related products
Request Quote for All Products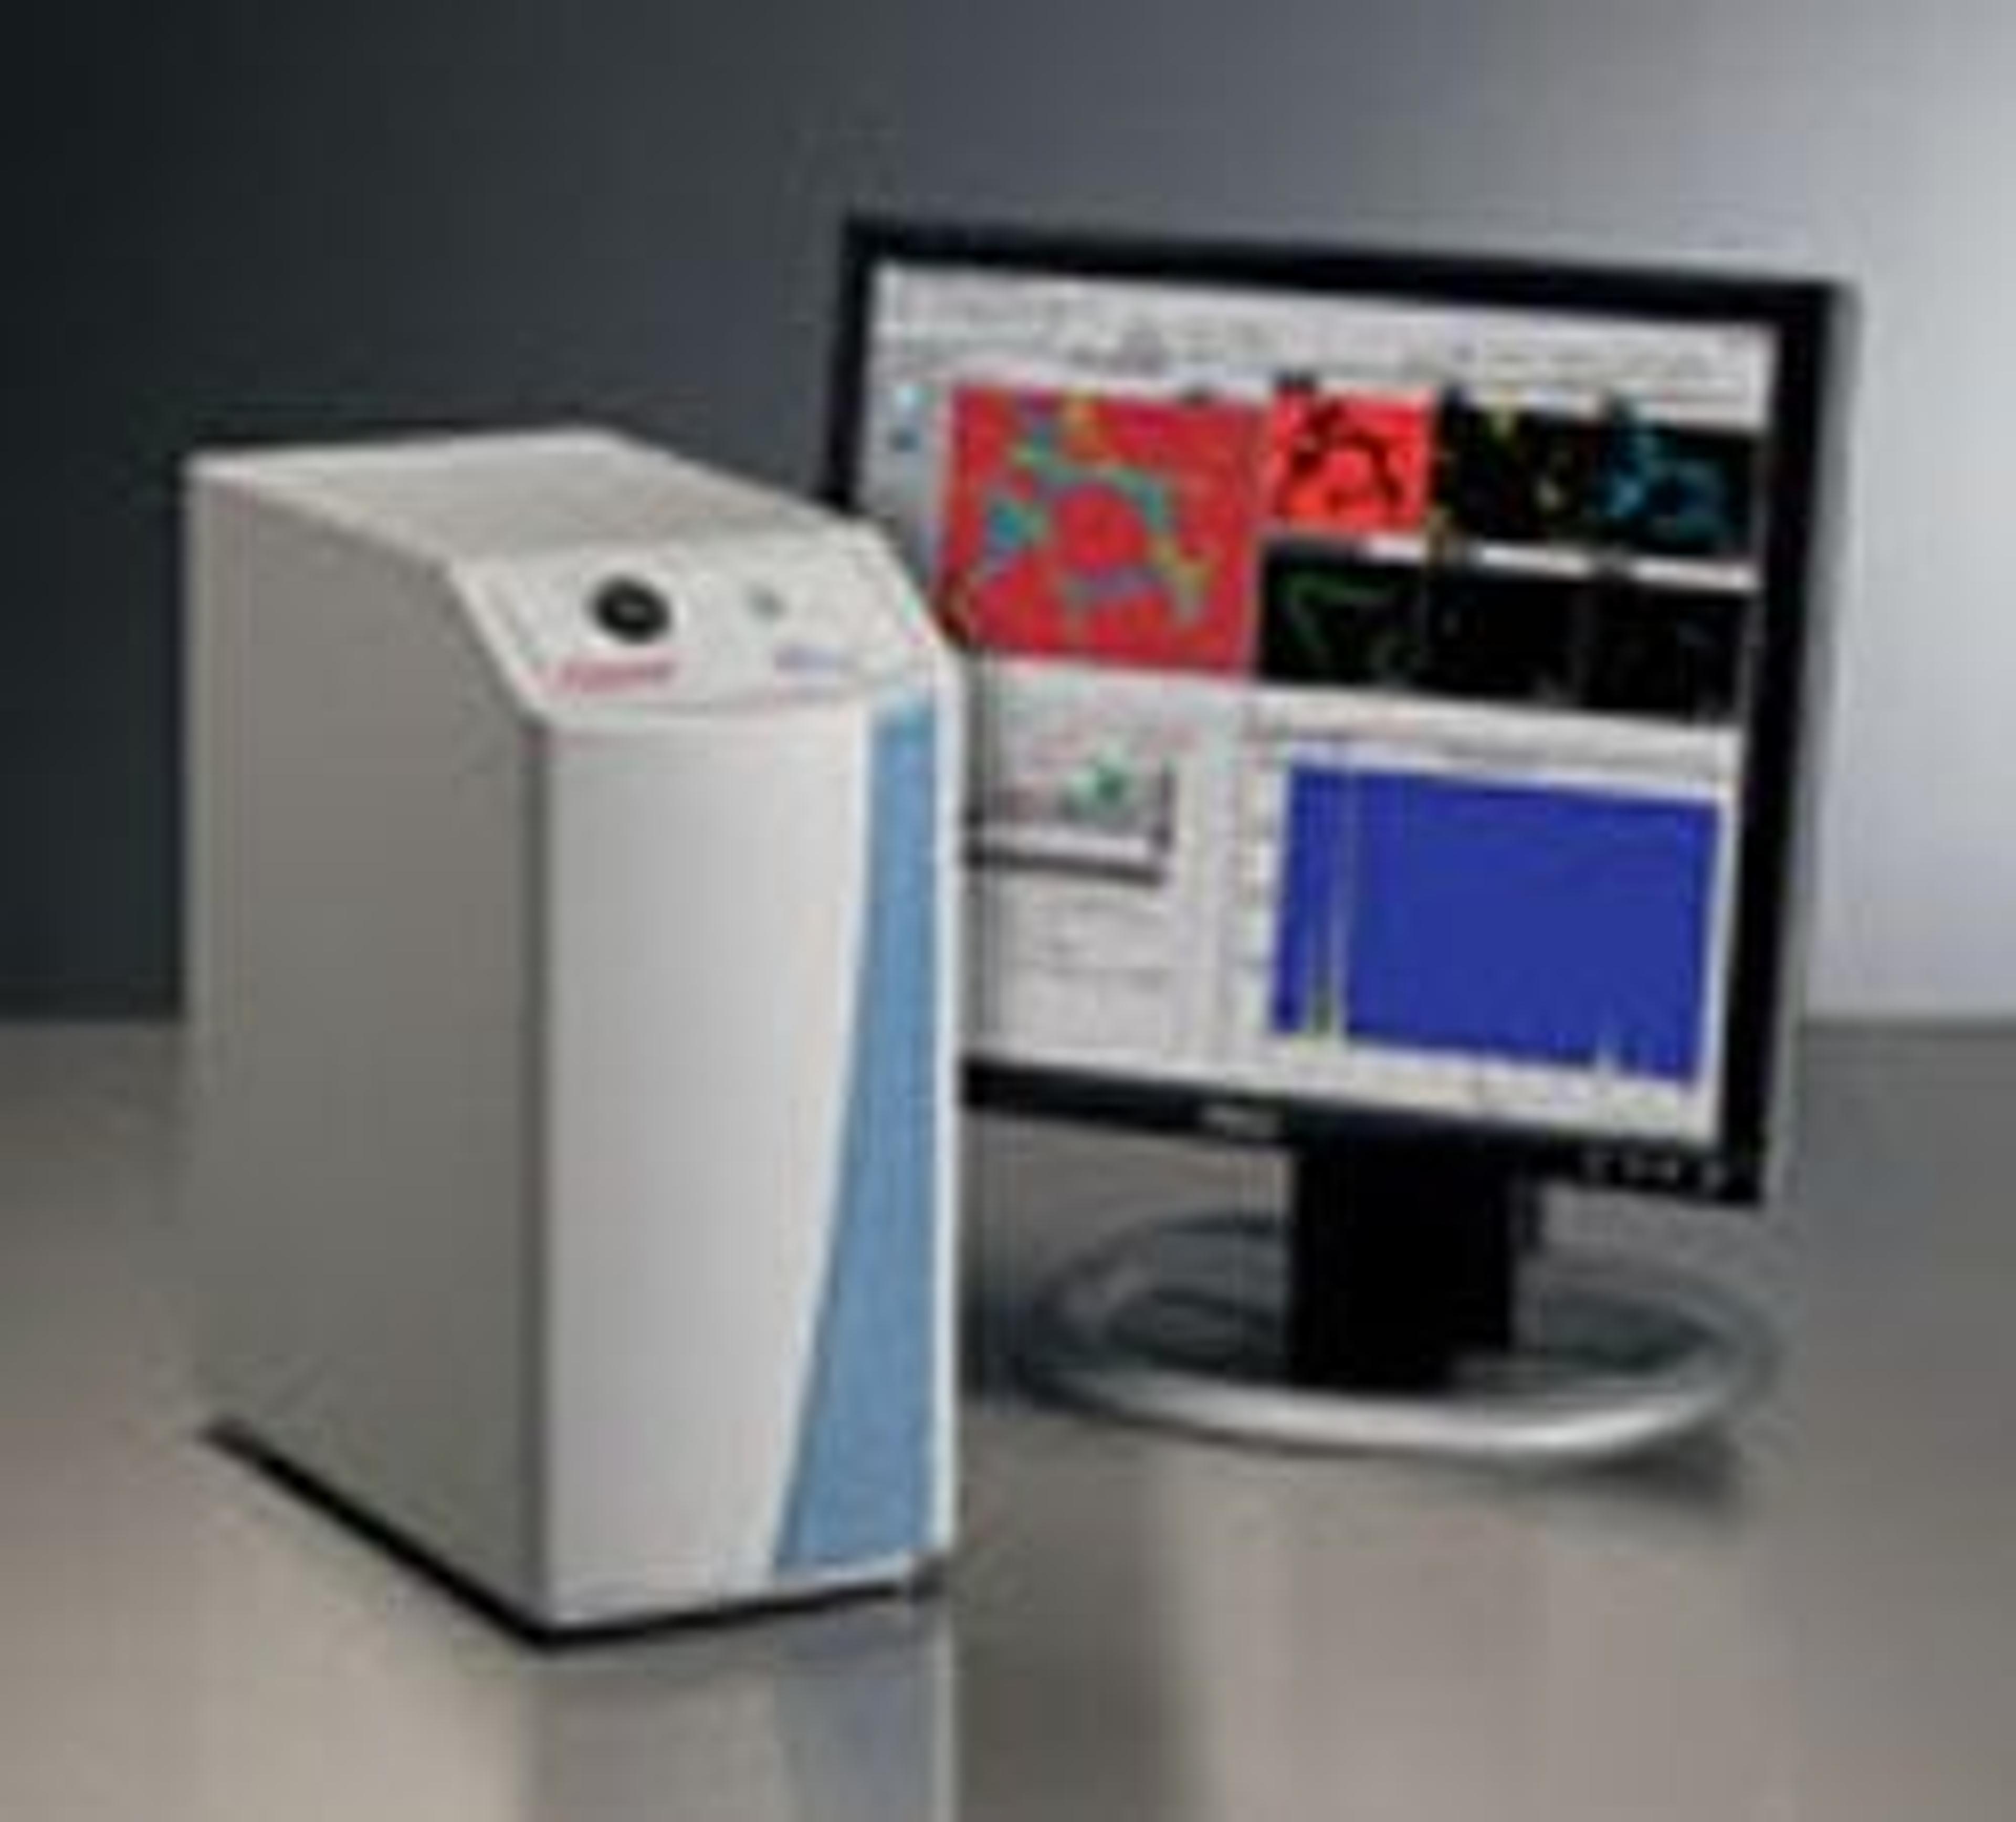
NORAN System 7 X-ray Microanalysis System
Thermo Fisher ScientificSpectral Analysis Identifies elemental peaks quickly and accurately using rule-based identification and peak shape deconvolution SpectraCheck both visually and statistically confirms the presence of an element using spectrum simulation and comparison routines—provides both an overlapped spectrum and a chi-squared value indicating goodness of fit Elemental peak references provide a complete set of spectral peak shapes collected with a typical EDS system The intensities from these shapes are automatically corrected to match the microscope detector—eliminates the need for periodic calibration of the system with standards Uses the PROZA Phi-Rho-Z matrix correction algorithm Point and Shoot Mode Integrates electron imaging and X-ray analysis Single mouse click provides both elemental identification and quantitative analysis of the selected areas of interest of the sample Areas on the sample are defined using points, rectangles, circles, polygon or with a magic wand tool Magic wand tool allows easy, instant outline of complex areas without having to manually draw a border The selection, based on gray levels, is made automatically with just one click Selected areas may be analyzed instantly or multiple areas may be selected for automated analysis Performs processing according to chosen settings Able to provide the required spectral results—from qualitative analysis to quantitative analysis with full standards Spectral Imaging Acquires a spectrum at every point—useful for imaging, X-ray mapping, Linescan and advanced automated analysis NORAN System 7 collects data that can be analyzed repeatedly without the need for reacquiring or changing acquisition parameters—with one click Analyze the collected data locally at the microscope or take the data offline to a different computer for report preparation COMPASS Allows all of the people in the lab to perform the same analysis and obtain consistent results Uses powerful multivariate statistical algorithms, as created by Paul Kotula et al. and licensed from Sandia National Labs Using advanced algorithms, Direct-to-Phase extracts and displays known phases while the data is still being collected Allow the EDS system to decide when sufficient statistics have been collected, or visualize the data as it develops Direct-to-Phase Data analysis concurrent with data collection - the speed of real time phase analysis Not only presents elemental data in maps and spectra, it develops an information-rich picture of the sample composition—and it produces complete data ten times faster than current X-ray microanalysis technology
NORAN System SIX X-ray Microanalysis System
Thermo Fisher ScientificWhen we developed our next generation X-ray microanalysis system, we made spectral imaging the heart of this analytical tool. Featuring a great combination of electronics designed for high resolution and high throughput, and easy-to-use and power software, the NORAN System SIX is your best choice for intelligent solutions. All your data, all of the time. No oops. No final decisions. It’s okay to change your mind. Spectral Imaging acquires a full dataset when you run a sample by collecting a complete, optimized energy spectrum at every point in the sample. Once collected, this dataset can be analyzed as many times as you like using a variety of analysis tools. Your best tool for compositional mapping. Spectral Imaging data combines elemental and spatial data to create an ideal representation of your sample. Analyze with familiar microanalysis tools for spectral analysis, x-ray mapping or linescans, or used advanced analysis tools such as COMPASS and XPhase to get deeper into your sample’s data. The compositional mapping tools on the NORAN System SIX increase in simplicity and decrease the subjectivity of the analysis. Your best tool for sample surveying. Seek and you shall be rewarded. NORAN System SIX includes great tools for exploring the sample. Point-by-point and area-by-area survey tools allow you to quickly locate critical features on the sample for reports and further analysis—just click or drag for instant answers. Linescans get you see changes in the morphology of the sample as you scan across a line. Includes qualitative and quantitative analysis. Quick and Easy Reports. Reports make your analyses look good. Easy to use, comprehensive, and customizable. Click, Print. Done. NORAN System SIX gives you great options for easily creating reports: In one click, your data is automatically placed in a Word or PowerPoint file, ready to be printed or sent to a client. Customizable templates are available, including the ability to put your company’s logo on the report. If you want to extract the data from NORAN System SIX and create the report with your own software (roll your own), all data is available in industry-standard formats such as .tiff and .csv. Reports can be created on a sample-by-sample basis, or as set of samples (project). Take our data to your office. Store your data in one place. Don’t tie up the microscope. Get your data, then off-load it. With the NORAN System SIX, you can freely install all your microanalysis software on an offline computer—whether it be a PC on your organization’s network, or your personal laptop computer. Use you microscope for collecting data. Use another computer for all of your analytical work. Because NORAN System SIX files are network and project manager friendly, you can easily share your results with colleagues. Features Drift Compensation option for long or high magnification acquisitions (read more) Analysis Automation option, providing an easy way to collect data from multiple stage locations (read more) Feature sizing with chemical typing option (read more) Quantitative mapping and linescans (read more) Spectral simulation for verification of peak identification(read more) One user interface/window for all application modes Project Explorer for easy project and data management Digital pulse processor and digital beam control electronics Higher throughput acquisitions, greater microscope control, accurate results Automatic “best choice” settings for acquisitions and analyses Peaks automatically identified during acquisitions and on-the-fly during analyses One-click Microsoft Word and PowerPoint reports Data is stored in industry standard formats Traditional X-ray Microanalysis Qualitative X-ray mapping and linescans Automatic quantitative analysis Exclusive PROZA matrix correction routine (read more) Electron image acquisition RGB image color overlays Automated Point-and-Shoot mode Spectral Imaging Collect a data set (up to 1024 x 1024 pixels) of full, deadtime-corrected spectrum at every point in a scanned electron image Complete, archival record of the sample Extract spectra, x-ray maps and linescans from the data set at any time Standard microanalysis tools—spectral analysis, image and x-ray maps, linescans, qualitative and quantitative analysis Accurate automatic peak identification COMPASS Automated Statistical Analysis Quickly generating “pure” component maps with single-pixel intensity Completely eliminates time-consuming point-by-point analyses Removes sample assumptions from the analysis (no ROIs and x-ray maps) Even a single distinct pixel in the data set is detectable Unparalleled solution for needle-in-a-haystack problems 2001 Macres Award winner and a 2002 R&D 100 winner Exclusively licensed to Thermo Electron by Sandia National Laboratories XPhase Distribution Software Provides a complete understanding of the phase distribution in a sample Provides true chemical localization from Spectral Imaging data Provides phase maps and extracted phase spectra Operates on grayscale and binary images No operator input required (manual mode available for power-users) Analyzes x-ray maps or COMPASS component maps Spectral Match Chemically identifies spectra Automatically run complete spectral analysis following the acquisition Matches an unknown using spectral database Search by selected energy range or complete energy range Several spectral databases available User-created databases