Is it really negative? The importance of using accurate metrics for COVID-19 diagnosis
As the WHO set guidelines for measuring COVID-19 viral loads during clinical diagnosis, one research group challenged the accuracy of this metric (and provided a better alternative)
14 Dec 2021

During the stages of COVID-19 disease, from pre-symptomatic, symptomatic, recovery or continued disease, there is a change in viral burden within an infected individual. When COVID-19 diagnosis is performed, the amount of virus determines if someone is positive or not. As this can vary with different test formats it will mean discrepancies may occur depending on the test used.
Due to the unprecedented nature of the pandemic, the metrics of COVID-19 diagnostic measurement were not fully standardized across the world. Although the World Health Organization (WHO) provided a guideline for diagnostic assay performance, one research group decided to examine just how standardized and reproducible this metric was. In this SelectScience® article, we speak with Daniel Evans about the dangers of using incorrect measurement units to quantify viral loads in COVID-19 patients.
Are Cq cutoffs a reliable metric for COVID-19 diagnostic decisions?
The primary diagnostic method for SARS-CoV-2 infection is RT-qPCR that detects viral RNA in patients. This test provides a quantitative readout known as Cq or quantitation cycle (also referred to as cycle threshold (Ct) or crossing point). Over the course of the pandemic, Cq values have become a common metric of SARS-CoV-2 infection, even informing in vitro diagnostics performance targets.
As Cq measurements aren’t typically used to measure viral loads, Evans, along with his supervisors at the National Measurement Laboratory, LGC, and the School of Biosciences & Medicine at the University of Surrey, decided to study the reproducibility of this metric for COVID-19 diagnosis and patient stratification. The results of this study appeared in Clinical Chemistry in 20211.
“During the summer of 2020, scientists had begun suggesting Cq cutoffs to stratify patients. That is, if a patient tested positive but was above a certain Cq value, they were less likely to be clinically relevant and didn’t necessarily need to isolate,” says Evans, the lead author of the study. “Later, WHO put out guidelines denoting a minimum Cq value of 25 as the target by which point-of-care tests needed to perform.”
Setting out to originally examine the limits of detection in E. coli infections in sepsis, Evans pivoted his work to apply the same concepts to study COVID-19 measurements and make a contribution towards the ongoing pandemic.
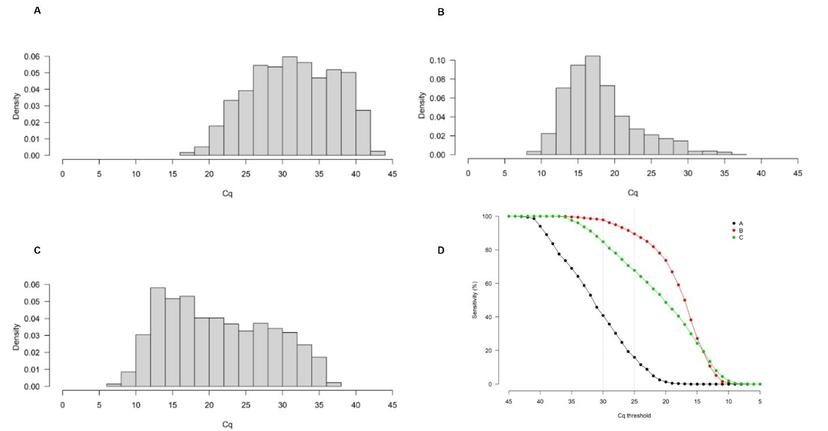
As part of the study, the group analyzed Cq distributions of SARS-CoV-2 results from 6000+ patients across three different clinical laboratories in the United Kingdom, Belgium, and the Republic of Korea. “We found a thousand-fold difference between the different laboratories for the same Cq value,” notes Evans. When the WHO-recommended Cq cutoff of 25 was applied to the different cohorts, a clinical sensitivity of about 16% was observed in cohort A (United Kingdom) whereas it was about 90% in cohort B (Belgium).
“This corresponds to a very large difference in viral copies per milliliter (copies/mL) measurement between one lab and another, despite the same Cq result.” The inter-lab Cq variation can be attributed to differences in protocols, sampling, assay preparation, reagents, and other laboratory-specific variables. Evans adds: “By using Cq measurements, we’re purely looking at the end result without fully factoring in protocol-specific variables.”
An analytically reproducible alternative: Converting SARS-CoV-2 metrics to copies/mL
Although using Cq as a diagnostic threshold may have seemed theoretically logical, in the past, Cq has not been used to manage other viral infections. Instead, viral copy-based values are typically employed.
As such, to evaluate copy number metrics, the three laboratories further analyzed control samples of an external quality assessment (EQA) scheme. These values were used to estimate the expected concentration range in copies/mL for a given control Cq. Further, control Cq values of 633 other laboratories from 39 countries participating in the scheme were also obtained for comparison purposes. Converting the patient datasets to copies/mL using the EQA dilution series (developed from control Cq values) reduced the differences between them, thereby providing a more analytically reproducible measurement metric.
“Our paper demonstrates that using Cq as the main unit for patient stratification in COVID-19 produces highly variable results,” Evans says. “Instead, using a copy-based unit of measurement would be relatively more accurate.” This can be done by using calibrated materials with the qPCRs to yield the underlying copy numbers corresponding to every Cq value. He adds: “Our aim is to increase the reproducibility of SARS CoV-2 quantification and help improve the accuracy of diagnostic tests.”
Applying different analytical tests for different phases of the COVID-19 wave
The varying differences in Cq values across the three cohorts can also be attributed to the viral distribution in the local population at the time of sample collection. A paper published by another research group, Hay et al., reports how measured SARS-CoV-2 viral RNA quantitative distribution within a population is linked to its reproduction number (R). When R > 1, there are more individuals with newer infections and, therefore, a higher viral burden in the population2.
“The larger number of patients with high viral burden measured in Belgium was possibly due to the country going through one of their peaks during the second wave when the data was taken,” Evans notes. “In comparison, in the UK, the viral burden within the patient population was much lower and this may be because the UK’s first lockdown resulted in a reduction in incidence.”
Evans continues: “Upon looking at that data, we put forth a theory that for COVID-19 testing, less analytically sensitive methods, such as lateral flow tests, might be better suited during the peak of the pandemic when there is high incidence and the viral burden in the population is higher. But as cases drop, more sensitive methods, such as PCR tests, may be better to measure relatively lower levels of viral burden in the general population to avoid false negatives.”
Summarizing the lessons learned from COVID-19 in using more appropriate measurements for future public health outbreaks, Evans adds, “Measurement science highlights the limitations of certain metrics and helps catch errors to improve accuracy in measurements. As we saw with COVID-19, Cq was not an ideal unit of measurement that introduced high levels of variability. It would have been better to use copies/mL. But now that we know this, we can do better in the future when measuring other viral diseases.”
Want to know more on this topic?
- Hear from Prof. Jim Huggett on the need for reproducible and standardized metrics for SARS-CoV-2.
- Join our expert speakers as they discuss why the choice of unit is important when quantifying virus in the panel discussion: A lesson from COVID-19 on the dangers of using Cq to quantify nucleic acids.
References:
Evans D, Cowen S, Kammel M, O'Sullivan DM, Stewart G, Grunert HP, Moran-Gilad J, Verwilt J, In J, Vandesompele J, Harris K, Hong KH, Storey N, Hingley-Wilson S, Dühring U, Bae YK, Foy C, Braybrook J, Zeichhardt H, Huggett JF. The dangers of using Cq to quantify nucleic acid in biological samples; a lesson from COVID-19. Clin Chem. 2021 Oct 11.
Hay JA, Kennedy-Shaffer L, Kanjilal S, et al. Estimating epidemiologic dynamics from cross-sectional viral load distributions. Science. 2021;373(6552)
Related Products
Request Quote for All Products
SARS-CoV-2 variant detection and identification
LGC Biosearch TechnologiesEffective genomic surveillance of SARS-CoV-2 variants begins with the right tools
Fully automated PCR systems for scalable RUO SARS-CoV-2 detection
LGC Biosearch TechnologiesKeep up with fluctuating testing demands in an economically viable way due to minimized labor costs enabled by automated sample processing, amplification, and data analysis workflows.