Improving laboratory performance with data-driven quality management
In this SelectScience webinar, experts explain how defining total allowable error and applying sigma metrics can guide smarter QC decisions and streamline laboratory workflows
15 Jan 2026
Experts Dr. Nils B. Person and Dr. Mark Borgman share practical strategies for data-driven quality control.
Modern clinical laboratories operate under mounting pressure to deliver rapid, reliable results while managing tighter budgets, staff shortages, and increasing regulatory demands. As testing menus expand and analyzer systems grow in complexity, laboratories are seeking new strategies to enhance quality without compromising efficiency.
To explore practical ways to achieve this balance, SelectScience® and Siemens Healthineers hosted the first in a two-part webinar series, Quality Data, Informed Action: Metrics and Assay Performance Amplified by Quality Indicators. The opening session, Precision in Practice: Using Metrics to Elevate Laboratory Quality, brought together Dr. Nils B. Person, Ph.D., FACB, FAACC, a clinical chemist with decades of experience in laboratory quality, and Dr. Mark Borgman, Medical Sciences Partner at Siemens Healthineers. The discussion examined how key metrics such as total allowable error and sigma performance can transform laboratory operations by embedding data-driven quality practices into routine workflows.
Defining quality in the modern clinical laboratory
Dr. Person began by addressing a core challenge in laboratory medicine: maintaining quality under real-world conditions. “One of the big quality challenges in the laboratory is maintaining laboratory quality under real-world constraints of staffing and resources,” he said. “This requires a highly efficient use of resources to limit wasted time and materials while still achieving our quality goals.”
Dr. Person outlined a systematic approach to achieving this, guided by the Clinical and Laboratory Standards Institute (CLSI) document C24 on statistical quality control. He explained:
- “First, we need to define the required quality for each of our assays.
- Second, we need to evaluate the current assay performance relative to those quality goals.
- And third, we need to select the appropriate quality tools that will most efficiently detect any significant changes in our assay performance.”
A key concept in defining analytical quality is total allowable error (TEa), the maximum acceptable deviation between a measured result and its true value without compromising patient care. “Ideally, we want the analytical error of the methods that we use to be less than the allowable clinical error, also referred to as total allowable error,” said Dr. Person.
Determining those thresholds, however, is complex. “There are no universally accepted values for this,” he added. “It requires the senior laboratory management to make choices and decisions about what is optimal for that specific laboratory.” To support that process, he highlighted the CLSI EP46 guideline, Determining Allowable Clinical Error Goals, as a valuable new resource for establishing clinically meaningful performance targets.
Measuring performance with sigma metrics
Once laboratories have defined quality goals, the next step is to measure how their assays perform against them. Here, Dr. Person introduced the sigma metric, a widely used tool that relates assay bias and imprecision to total allowable error. “The sigma metric is a way to assess analytical performance relative to our allowable error goal,” he said.
He explained that a high sigma value reflects robust performance.
- “If that sigma metric is six or more, assay performance is absolutely excellent.
- If the sigma metric is between four and six, the assay performance is quite good.
- As the sigma metric gets down to about three, now we’re just meeting the clinical need, and we need to monitor the assay more closely.”
Calculating sigma, however, depends on reliable data, and Dr. Person cautioned against depending on inter-laboratory survey results. “QC material peer groups or inter-lab survey mean differences do not reliably assess assay bias with patient samples,” he said. “If we don’t have a reliable estimate for bias, what we really should do is use zero bias, not some unreliable number just because we want to put a number in the equation.”
He emphasized that laboratories should rely on their own data and performance evaluations wherever possible. “Optimally, the sigma metric that we use in the laboratory needs to be specific for our lab, based on local data and local use of the analyte.”
Simplifying quality control without losing reliability
An additional focus of the webinar was quality control (QC) efficiency. Dr. Person noted that overly complex QC practices often create unnecessary workload and confusion. “Most inefficiency as well as wasted time and resources occurring when performing routine QC, result from some very common misunderstandings,” he said, citing the tendency to treat every control result beyond two standard deviations as an assay failure.
He explained that such strict rules can lead to frequent false rejections, which distract staff from identifying true analytical errors. “Even though there’s nothing wrong with the analytical process, every once in a while, when you test a QC sample, you may get a rejection. That doesn’t necessarily mean something’s wrong.”
The CLSI C24 document and the Westgard Rules offer structured approaches to manage this. “For a 6-sigma assay, one that performs very well relative to the clinical requirement, a simple plus or minus 3 SD rule is all we need,” he said. “The only time we have to implement all of these rules is when we have assays where the assay performance is very close to the clinical error requirement.”
He also clarified a common misconception about QC’s purpose. “QC is not there to directly verify accuracy,” he said. “QC is about detecting change, not directly verifying accuracy.” Quoting a manufacturer’s own guidance, he added, “The intended use for this product is to monitor the precision of laboratory testing.”
Managing multiple analyzers and reagent lots
Many laboratories now operate multiple analyzers or even multisite networks. Dr. Person explained that using identical QC targets across systems can introduce hidden errors. “The target mean that we use for our QC may vary between individual instruments, even though nominally the instruments are identical,” he said. “For the QC rules to function with optimal efficiency, the target mean needs to be derived from data for that analyzer.”
To maintain alignment, he recommended creating internal “mini peer groups” across instruments or sites to calculate local mean values. “We establish a peer mean across all the instruments in our lab or across all the instruments across our multiple sites,” he said. “And we use that mini peer group mean as our benchmark.”
Dr. Person also addressed reagent lot verification, emphasizing that QC results alone cannot confirm consistency between lots. “QC results cannot be used to verify consistency of results for patient samples when changing reagent lots,” he explained. “We have to test patient samples in order to verify that a new reagent lot is acceptable for use.”
Automation and Total QC management
Following Dr. Person’s deep dive into theory and method, Dr. Mark Borgman discussed how automation can translate those principles into daily laboratory workflows. “We now have the technology to easily implement complex quality control protocols and assay verification testing into our normal laboratory workflow,” he said.
Dr. Borgman introduced Siemens Healthineers’ Atellica® Systems as an example of how automation can support end-to-end quality management. “Atellica Systems offers so much more than automated QC orders that we actually call it Total QC management,” he said. The platform features:
- Onboard refrigerated QC storage.
- Configurable QC triggers that can automatically initiate QC tests after key events, such as reagent changes or calibration.
- A QC by test count function that provides the ability to incorporate different QC frequency schedules based on run size.
- A QC as-required function that ensures QC is performed before results are released, helping users see what QC has been run as well as what has not been run.
Dr. Borgman also described how the system’s QC parallel study automates the process of establishing new QC lot ranges. “Parallel testing is performed on the same analyzer, the same reagent pack, at the same time, and therefore in the same environment as the current QC lot,” he said. “It eliminates operator variation and makes it easy to establish lab-specific targets.”
The Atellica Lab Evaluation Suite, meanwhile, automates reagent comparison and precision studies, generating CLSI-compliant reports instantly. “Any operator can feel confident in performing that study,” Dr. Borgman added.
Turning data into informed action
Both speakers emphasized that the purpose of metrics and automation is not abstraction, but empowerment. “The upfront time devoted to defining assay quality goals is not a theoretical exercise,” said Dr. Borgman. “These are achievable, actionable processes that are certain to bolster your quality and success.”
Through structured quality metrics and intelligent automation, laboratories can transform their operations from reactive troubleshooting to proactive, data-informed management, improving both efficiency and confidence in patient results.
Both parts of the Quality Data, Informed Action: Metrics and Assay Performance Amplified by Quality Indicators webinar series are available to watch on demand. Find them in the links below.
- Watch Part 1 on demand: Precision in Practice: Using Metrics to Elevate Laboratory Quality
- Watch Part 2 on demand: From Data to Action: Leveraging Essential Quality Indicators and Digital Solutions to Improve Patient Safety
Related products
Request Quote for All Products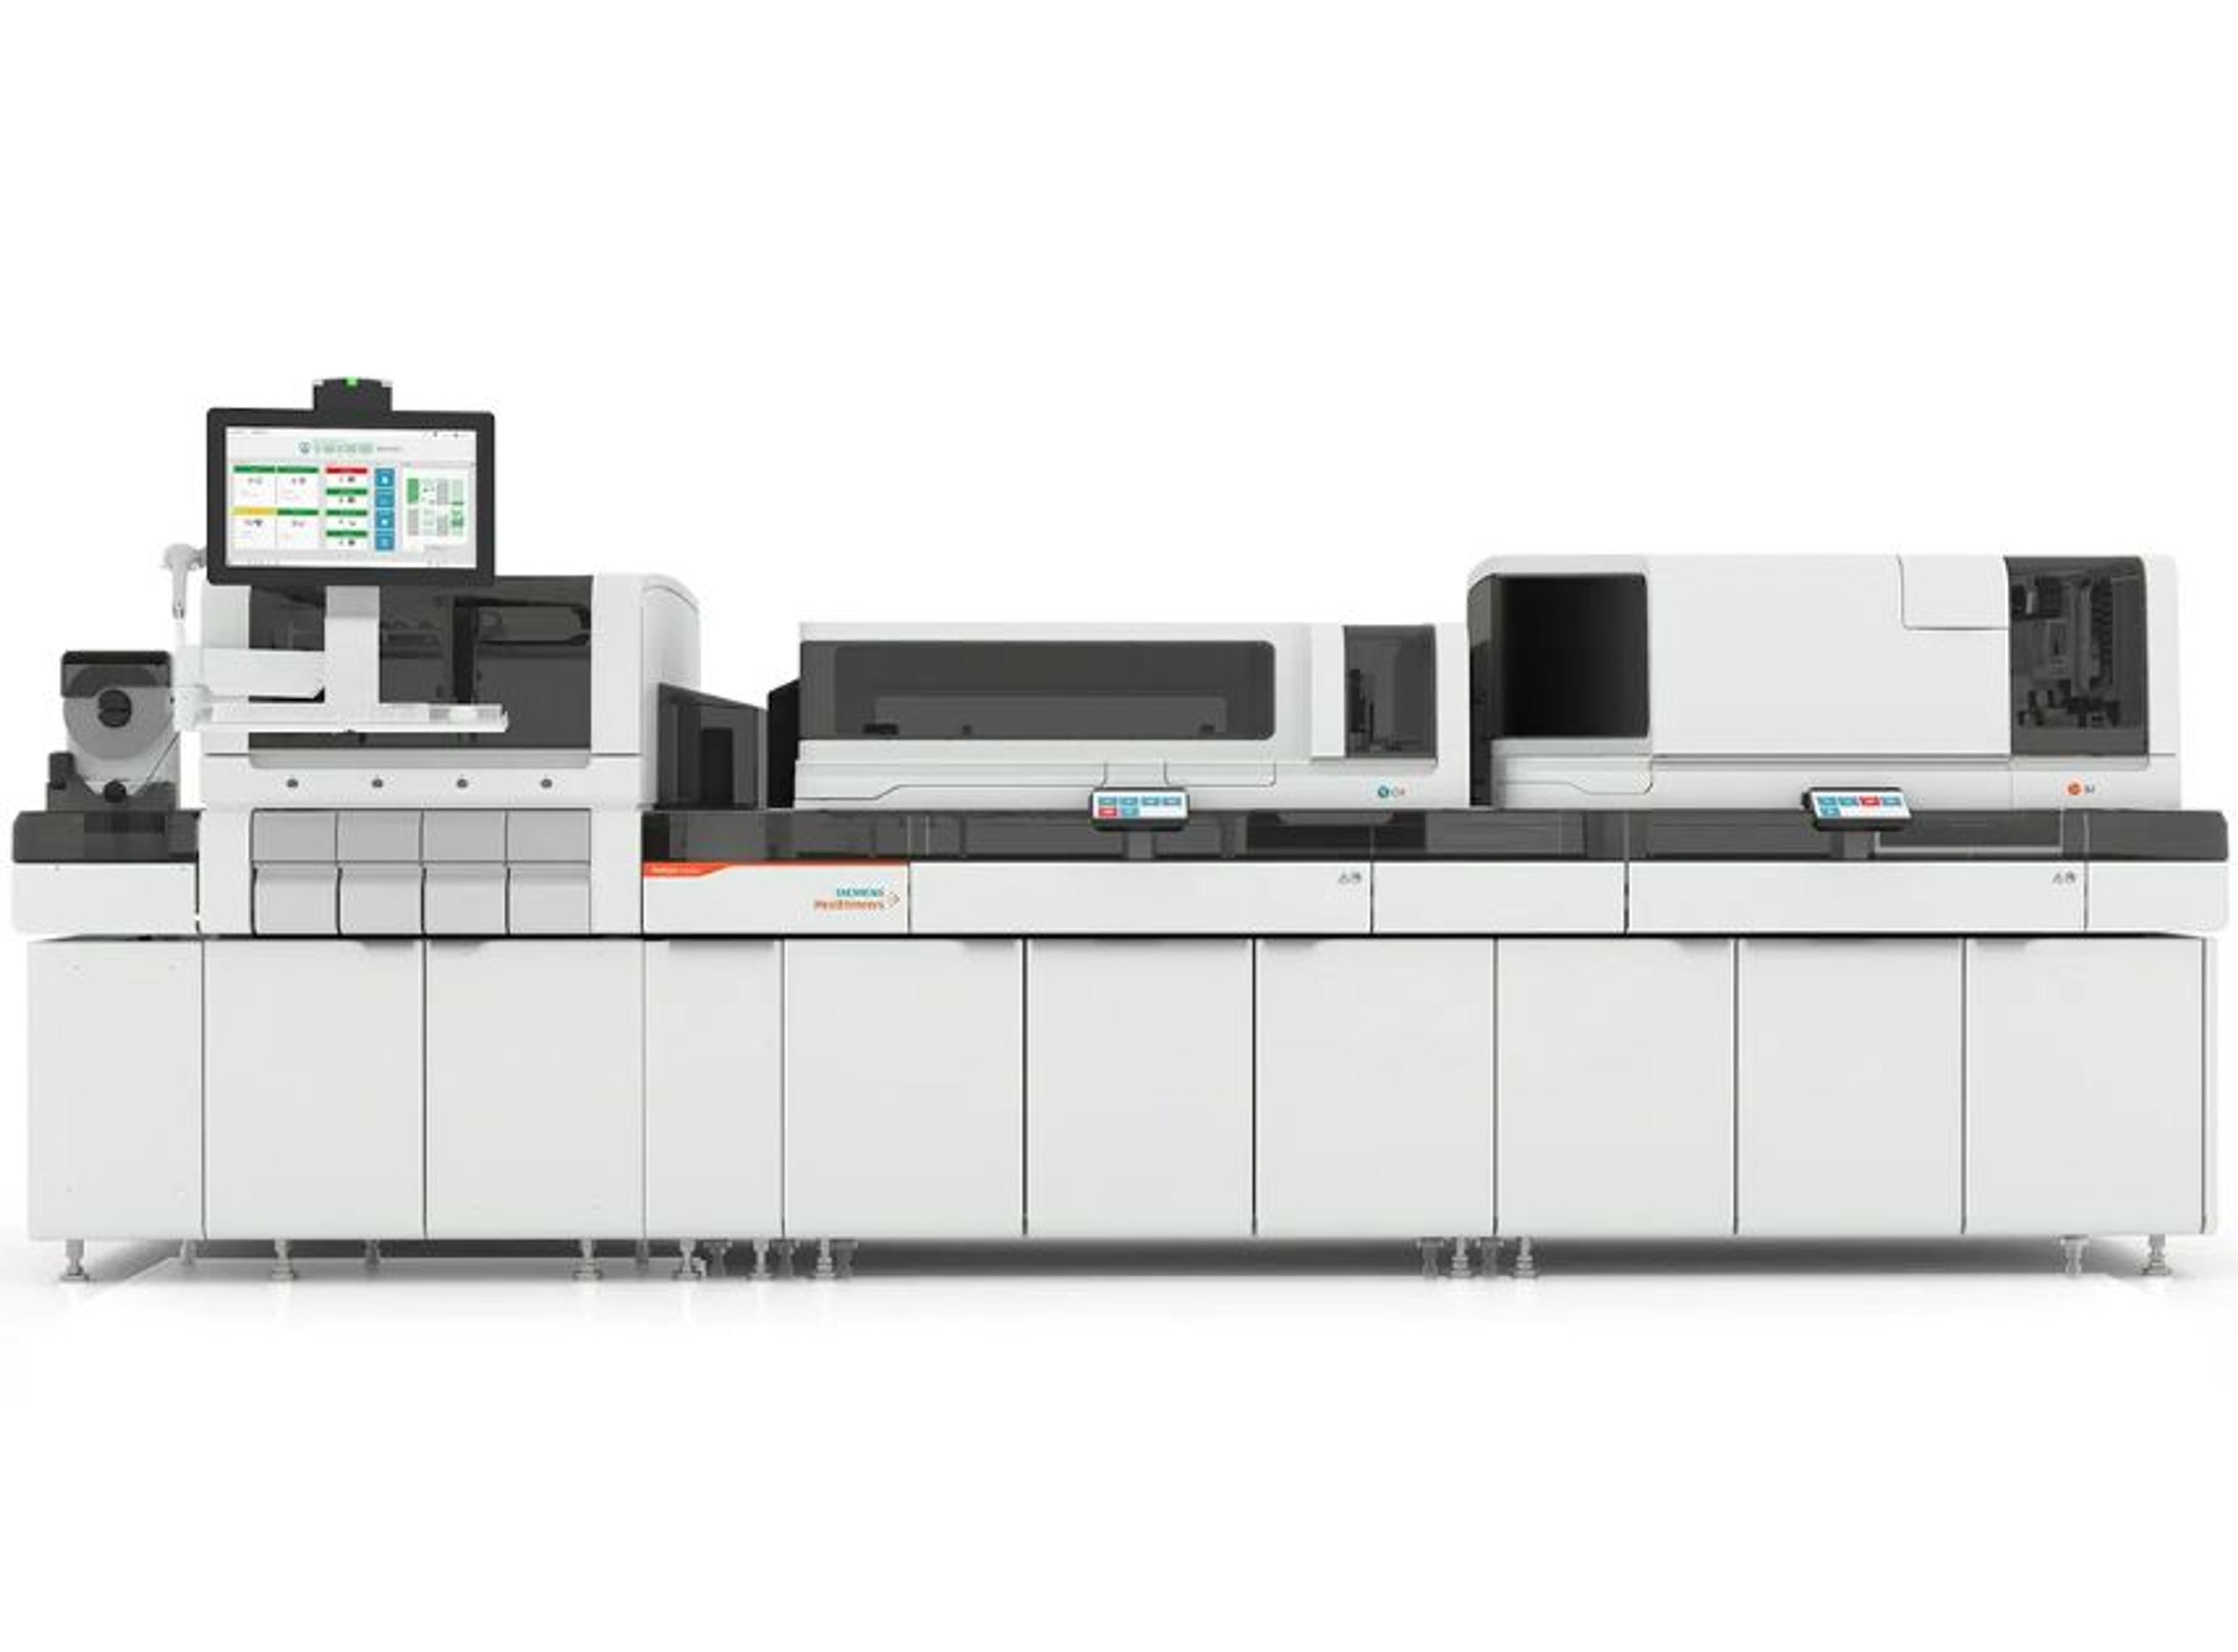
Atellica® Solution
Siemens HealthineersAtellica® Solution: new flexible, scalable, automation-ready immunoassay and chemistry analyzers from Siemens Healthineers (For within the U.S)
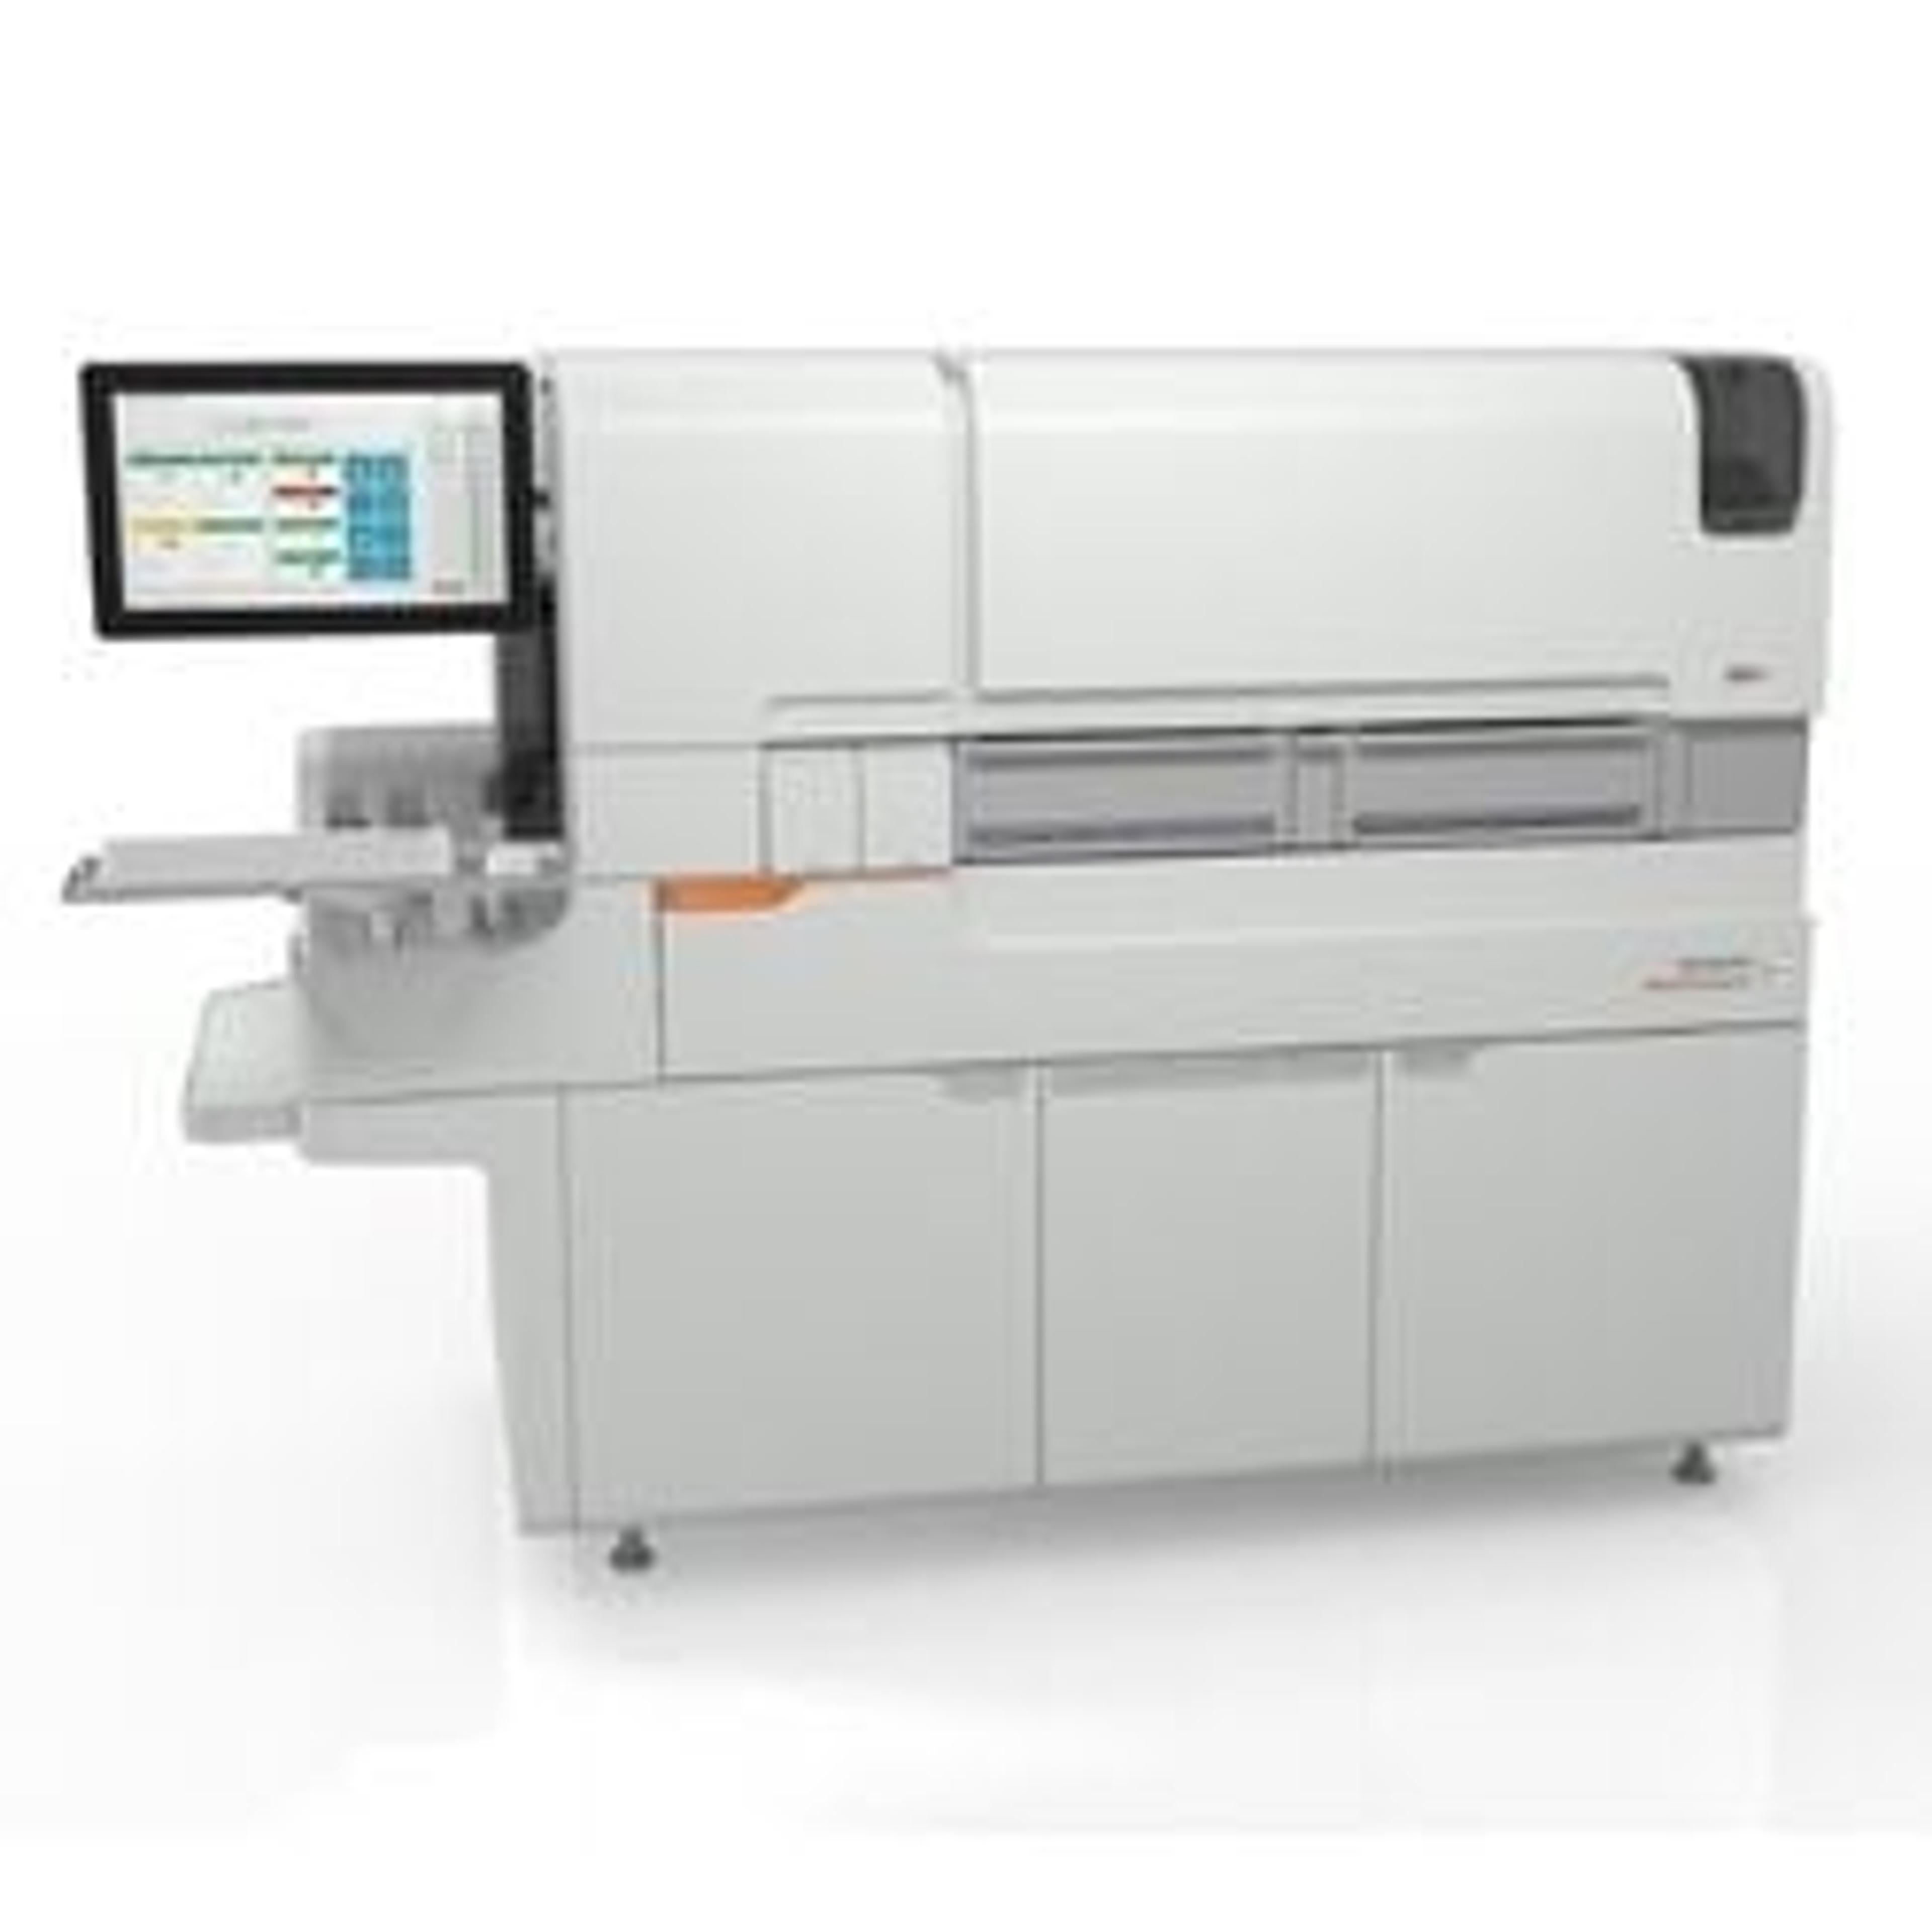
Atellica CI Analyzer
Siemens HealthineersDesigned to deliver equivalent results across an entire network, the Atellica CI Analyzer brings the power and possibility of the central lab to spoke and STAT laboratories.